How to create and manage a Health Monitor for OVHcloud Public Cloud Load Balancer
156 visualizações
Objective
Learn how to create and manage a Health Monitor for your OVHcloud Load Balancers using various interfaces such as the OVHcloud Control Panel, Command Line Interface (CLI), Horizon, and Terraform.
Requirements
- An active OVHcloud account
- Understanding of the Load Balancer concepts
- An active Public Cloud project
- A previously configured Load Balancer within your OVHcloud project
Instructions
Acesso à Área de Cliente OVHcloud
- Ligação direta: Public Cloud Projects
- Caminho de navegação:
Public Cloud> Selecione o seu projeto
Creating a Health Monitor
Health Monitors play a crucial role in managing the availability and performance of services hosted on infrastructures such as the OVHcloud Public Cloud. They perform regular checks on servers to ensure their ability to handle incoming requests. If a server fails to meet the established health criteria, it is temporarily removed from the pool, ensuring that traffic is directed only to functional servers.
Types of Health Monitors and Configurations
Different types of Health Monitors cater to various specific needs:
HTTP/S
- Performs HTTP or HTTPS requests, ideal for checking the health status of web applications or REST APIs.
url_path: Targeted path for the check, default is/.http_method: HTTP method used for the check, usuallyGET.expected_codes: Response codes indicating a healthy state, typically200.
PING
- Sends ICMP pings to test the network availability of a server.
TCP
- Attempts to establish a TCP connection to confirm the availability of a service listening on a given port, without data transfer.
TLS-HELLO
- Initiates an SSL/TLS negotiation with a "Client Hello" message, verifying the server's SSL/TLS response capability.
Uses and Key Points
- HTTP/S and TLS-HELLO checks are suited for secure contexts, especially when client certificate authentication is required.
- PING and TCP types are suitable for basic connectivity checks, without requiring specific server responses.
The precise configuration of Health Monitors, including the frequency of checks (delay), the maximum wait time for a response (timeout), and the number of attempts before marking a server as failing (max_retries), is essential for effectively balancing rapid problem detection while minimizing false alarms and reducing the load on monitored servers.
Key Configuration Options
url_path: Specifies the path for HTTP/S requests, allowing targeting of specific endpoints for verification.http_method: Determines the HTTP method (GET, POST, HEAD) to use for HTTP/S checks.expected_codes: Configures the HTTP response codes considered valid, indicating the server is healthy.delay: Interval in seconds between each health check, allowing control over the frequency of tests.timeout: Maximum waiting time for a server response before considering it failing.max_retries: Number of failed verification attempts before a server is marked as failing.
Best Practices for Configuring Health Monitors
Effectively setting up a Health Monitor is crucial for maintaining the high availability and performance of your online services. Here are best practices for optimizing your configuration:
Tips for HTTP Health Monitors
When configuring Health Monitors for web applications, keep the following tips in mind:
- URL Path (
url_path): Choose a lightweight and fast-loading path for health checks, ideally a page that does not require heavy processing or authentication. - HTTP Method (
http_method): Use less resource-intensive methods, such asHEADorGET, to minimize the impact on server performance. - Expected Response Codes (
expected_codes): Configure the HTTP response codes that indicate a server is healthy, typically200.
Monitoring and Testing
- Validation: Test your configuration by simulating server failures to ensure that the Health Monitor responds as expected.
- Monitoring: Use OVHcloud monitoring tools to track the performance and health status of your Load Balancer and adjust the configuration as needed. See Public Cloud Load Balancer monitoring with Prometheus.
By integrating these best practices into your configuration process, you maximize the availability and performance of your hosted applications, while ensuring an optimal user experience.
Monitoring and Optimization
To maintain optimal performance, it is recommended to:
- Regularly monitor the health of your servers and the efficiency of your Load Balancer.
- Adjust the Health Monitor settings (delay, timeout, max-retries) as needed based on observed performance.
- Explore optimization strategies based on performance data and feedback.
Configuring a Health Monitor through various OVHcloud Interfaces
Depending on the interface chosen, here are the steps to follow:
OVHcloud Control Panel
Follow these steps to add a Health Monitor to a pool of your OVHcloud Load Balancer, which will monitor the health status of the servers in the pool:
1. Click on Load Balancer in the left menu and select the Load Balancer you want to configure.
2. Go to the Pools tab, then click on the Pool for which you want to create a Health Monitor.
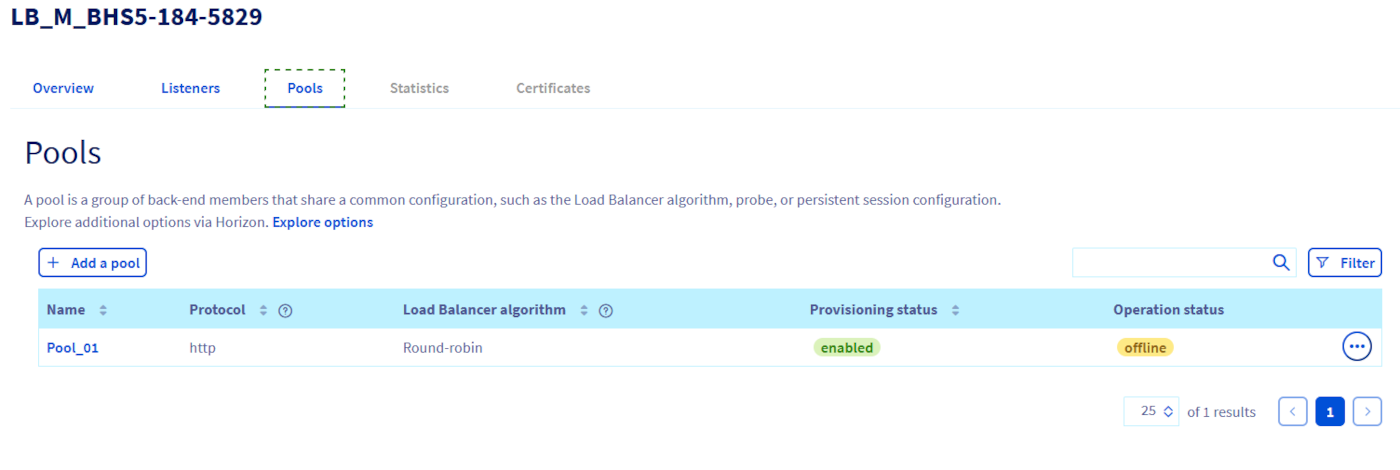
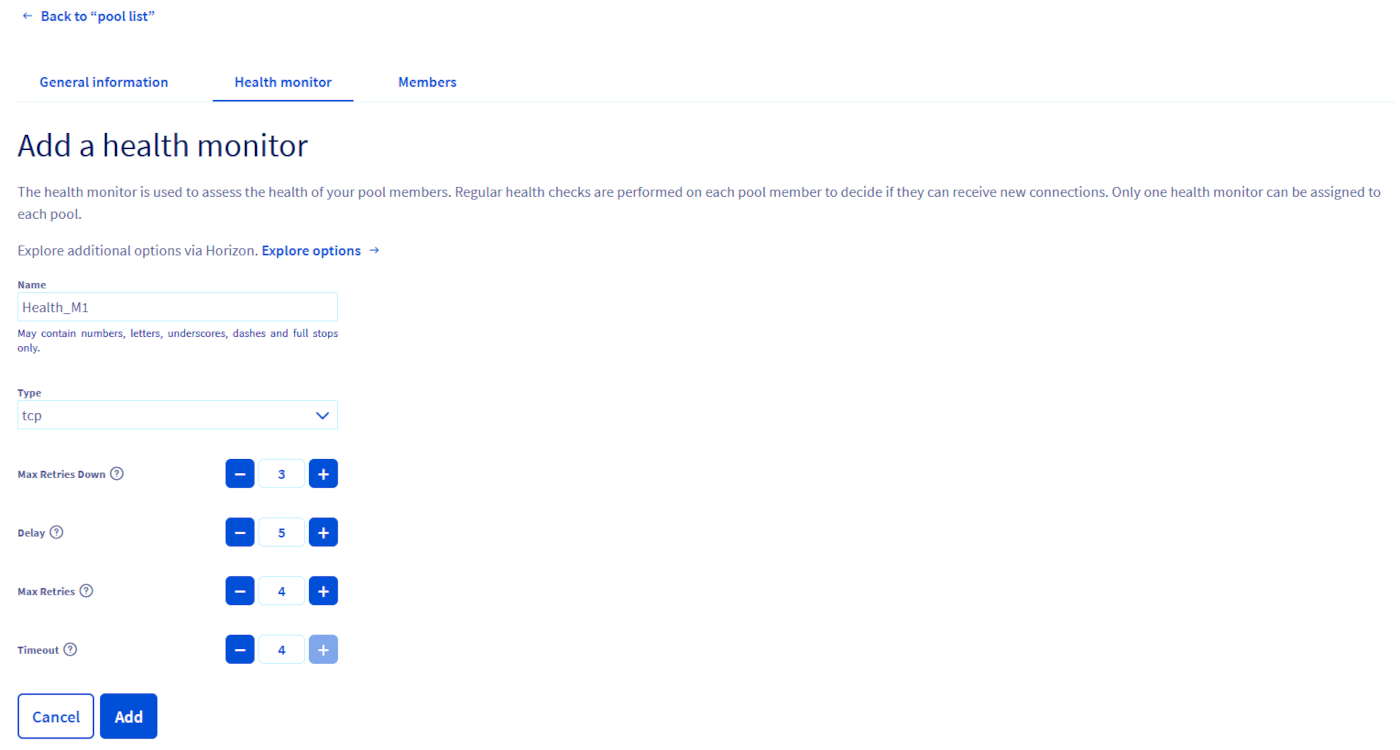
3. Click on the Health Monitors tab within the Pool details, then on Add a Health Monitor.
-
General Information:
- Name: Must contain only letters, numbers, underscores (
_), dashes (-), or dots (.). - Type: Select the type of Health Monitor (e.g. HTTP, HTTPS, TCP, TLS-hello).
- Name: Must contain only letters, numbers, underscores (
-
For HTTP and HTTPS types:
- URL PATH: Specify the path used for the test.
- Expected Code: Indicate the expected HTTP status codes, which can be a single digit, a list of digits separated by commas, or a range (two digits separated by a hyphen).
-
Test Settings:
- Max Retries Down: Number of connection failures allowed before marking the member as failing (between 1 and 10, default 3).
- Delay: Interval between two tests of the Health Monitor (must be greater than the timeout).
- Max Retries: Total number of connection failures allowed before marking the member as inactive (between 1 and 10).
- Timeout: Duration after which a test stops (must be equal to or greater than the periodicity).
4. Once all the information is filled in, click on Add to activate your Health Monitor.
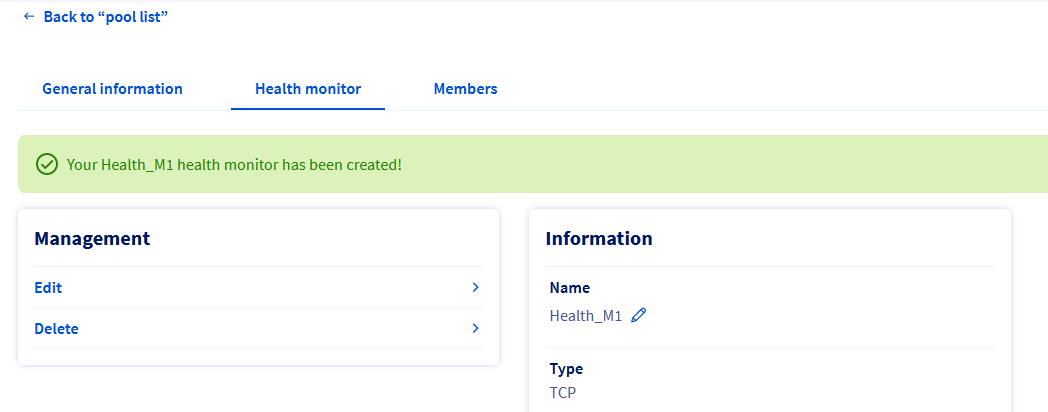
This process creates a Health Monitor that will regularly perform health checks on each member of the pool, using the results to determine whether the member should receive new connections. Only one Health Monitor can be set for each pool.
CLI (OpenStack)
1. Ensure the OpenStack CLI tool is installed and configured on your machine.
2. Use the following command to create a Health Monitor:
Replace with the ID of your Pool.
3. Confirm the creation of the Health Monitor by listing the Health Monitors associated with your Load Balancer using:
Horizon (OpenStack)
There are two ways to access the Horizon interface:
- To log in with OVHcloud Single Sign-On: Use the
Horizonlink in the left-hand menu under "Management Interfaces" after opening yourPublic Cloudproject in the OVHcloud Control Panel. - To log in with a specific OpenStack user: Open the Horizon login page and enter the OpenStack user credentials previously created, then click on
Connect.
In the left menu, click on the Network tab and select Load Balancers.
Choose the Load Balancer you want to configure and click on the Health Monitors tab.
Click on Create Health Monitor and fill in the required fields such as type, check interval, maximum retry count, and timeout.
Confirm the creation by clicking on Create.
Terraform
Create a .tf file and define your Health Monitor as a resource. For example:
Replace <POOL_ID> with the ID of your Pool. For more details on the available options for this resource, refer to the official documentation for the openstack_lb_monitor_v2 resource on the Terraform Registry.
Applying the Configuration
To apply your Terraform configuration:
- Run
terraform initto initialize the Terraform working directory. - Run
terraform applyto apply the changes defined in your configuration.
Verification
After running terraform apply, Terraform will provide you with a summary of the resources created, modified, or deleted. This confirms the creation or update of your Health Monitor.
Each method offers specific advantages depending on your familiarity with the tools and your working environment. The choice of interface depends on your personal preferences and the technical requirements of your project.
Go further
Join our community of users on https://community.ovh.com/en/.

