Tracking slow MySQL queries with Logs Data Platform
252 visualizaciones
Objective
MySQL is one of the most popular options in database software. It has many features and can answer complex queries with great performance. But with time, your database expands itself, its complexity grows, and the performance will naturally decline. There are many tips available to improve the speed of your queries but to rectify this you will have to know which queries are slow.
This guide will help you to track your slowest queries and send them to Logs Data Platform for further analysis.
Requirements
Before, you must read these three guides:
- Starting with Logs Data Platform.
- How to setup a Logstash input?
- Using Filebeat with Logs Data Platform.
Instructions
Configure the MySQL slow query logs
To send your logs to Logs Data Platform you first need to activate the slow query logs in your MySQL configuration.
We recommend you refer to the official MySQL documentation for your own version of MySQL. For example here is a working configuration on MySQL 5.6:
If you add these lines to your MySQL configuration file and restart it, MySQL will then log any query taking longer than 0.5 seconds to complete in the file /var/log/mysql/slow-queries.log
Here is a sample of the lines produced by the slow query log:
Slow query logs are multi-line logs giving information:
- The time of creation of the log.
- The user, the host, and the thread Id associated with the query.
- The query duration time, with the table lock duration time, and the number of rows sent and examined.
- The timestamp of the actual query.
- The query itself.
Configure Filebeat on your system
Our favorite way to send MySQL slow query logs is to send logs directly to Logs Data Platform by using Filebeat. We cover Filebeat in depth in another tutorial. Here is a minimal filebeat.yml configuration file.
Do not forget to replace with the write token value of your log stream.
Enable filebeat MySQL support with the following command:
It will generate a new module file: /etc/filebeat/modules.d/mysql.yml, please change it to include all your MySQL error/slow path files:
Launch Filebeat:
Use:
or
depending on your distribution.
Try to run some slow queries in your database. For this you can use this database sample and use join and like queries. Alternatively, you can use the MySQL Sleep query:
SELECT SLEEP(2);Exploit your results in Graylog
A fully parsed log looks like this:
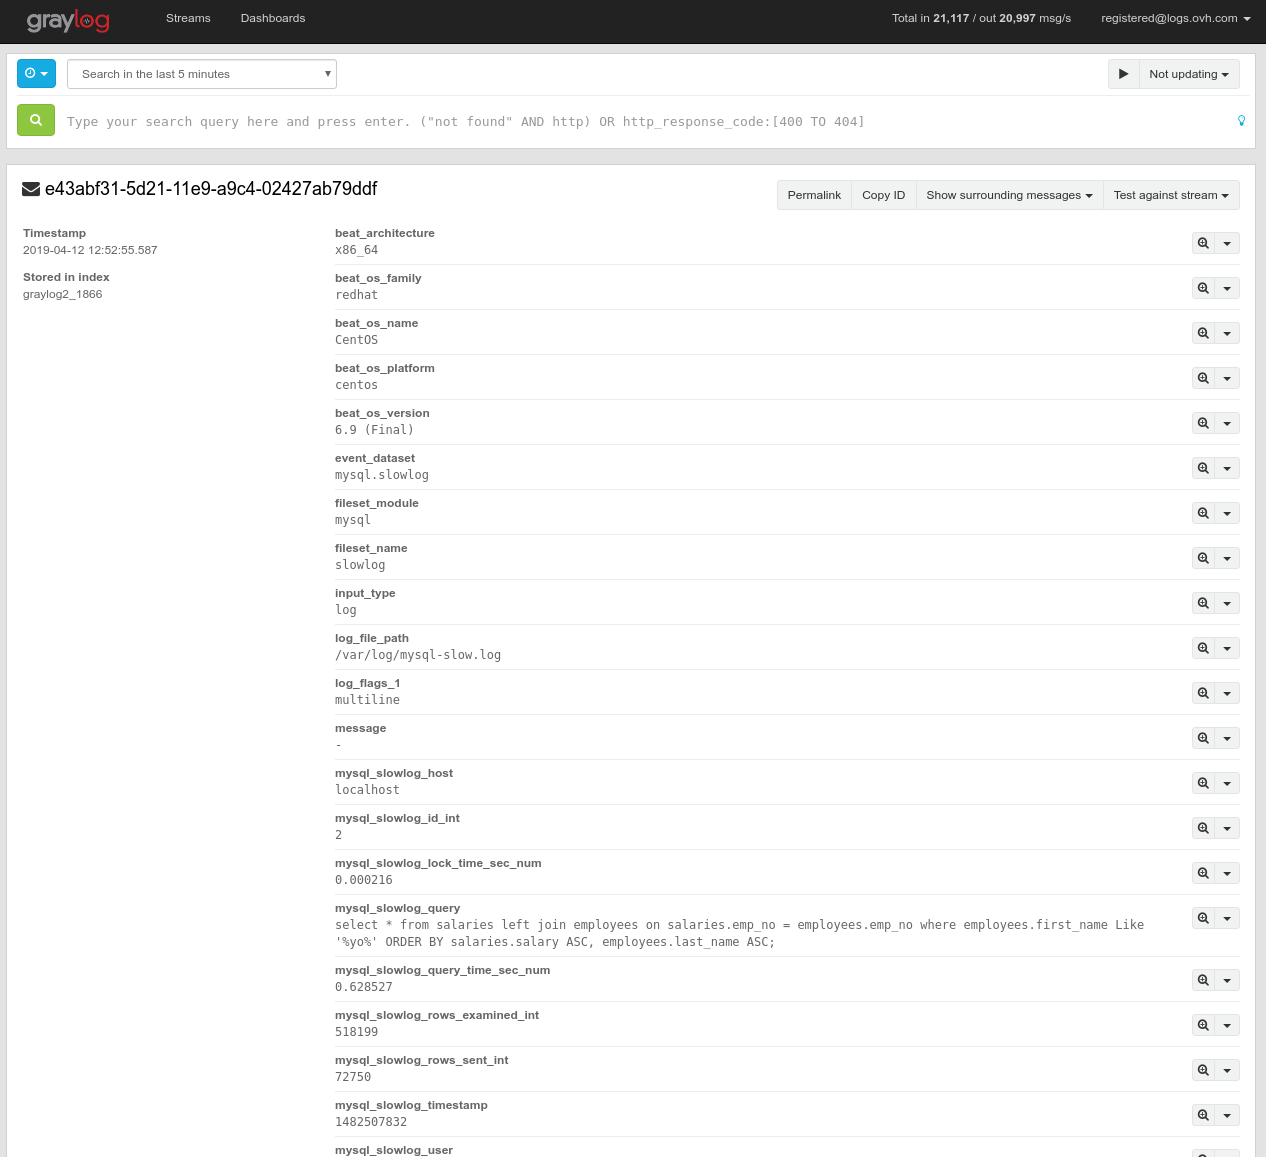
- The mysql_slowlog_query_time_sec_num is already available for further analysis.
- You can track the mysql_slowlog_user and the mysql_slowlog_host that trigger the slowest queries.
- You have the mysql_slowlog_rows_examined_int scanned and returned
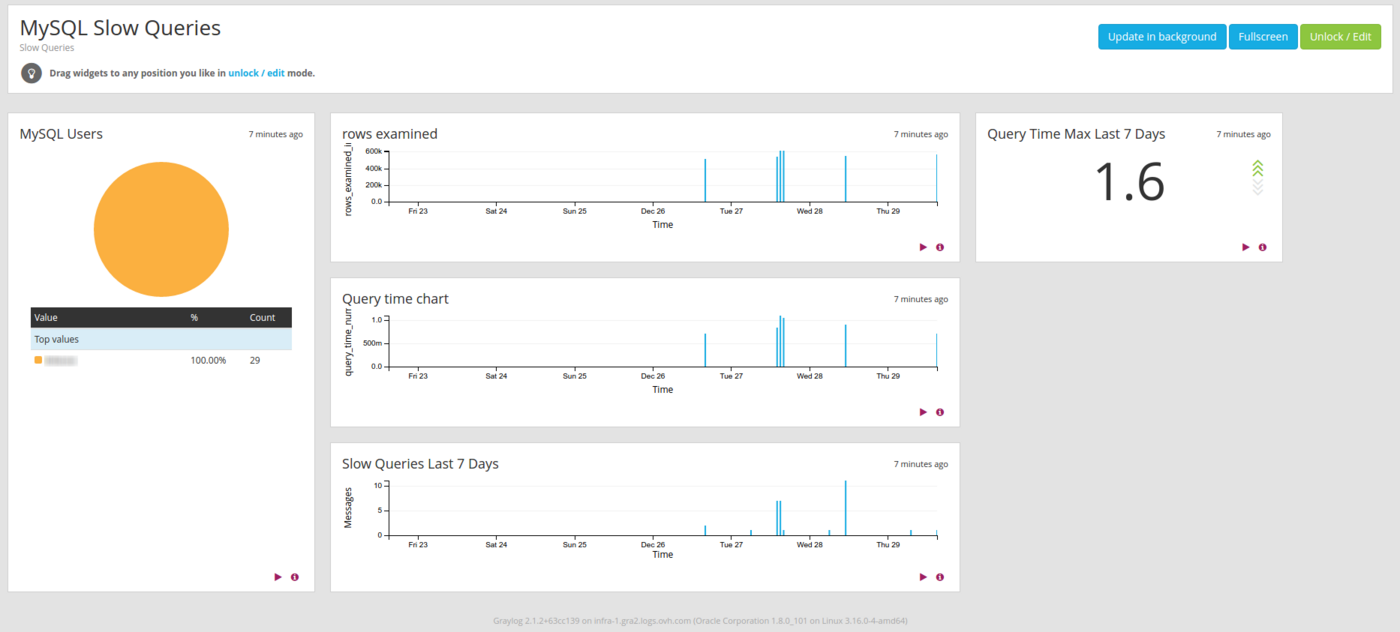
All this information can help you to analyse the most difficult queries for your database. You will know when to scale and when your database is too big for your hardware or when to optimize your queries. Of course it is always better to have a nice dashboard to display your own key performance indicators. One way to have this critical information as soon as it arrives is to use the alerting feature.
Go further
- Getting Started: Quick Start
- Documentation: Guides
- Community hub: https://community.ovh.com
- Create an account: Try it!

