Set up service integration for Public Cloud Databases
1077 Ansichten
Objective
Cross Service Integration allows you to expose your Public Cloud Databases Logs and Metrics.
This guide explains how to use Cross Service Integration.
Out of scope:
- Expose metrics and logs outside of OVHcloud Public Cloud
- MongoDB engine is not supported
Requirements
- A Public Cloud project in your OVHcloud account
- A database running on your OVHcloud Public Cloud Databases (this guide can help you to meet this requirement)
- Access to the OVHcloud API (optional)
OVHcloud Control Panel Access
- Direct link: Public Cloud Projects
- Navigation path:
Public Cloud> Select your project
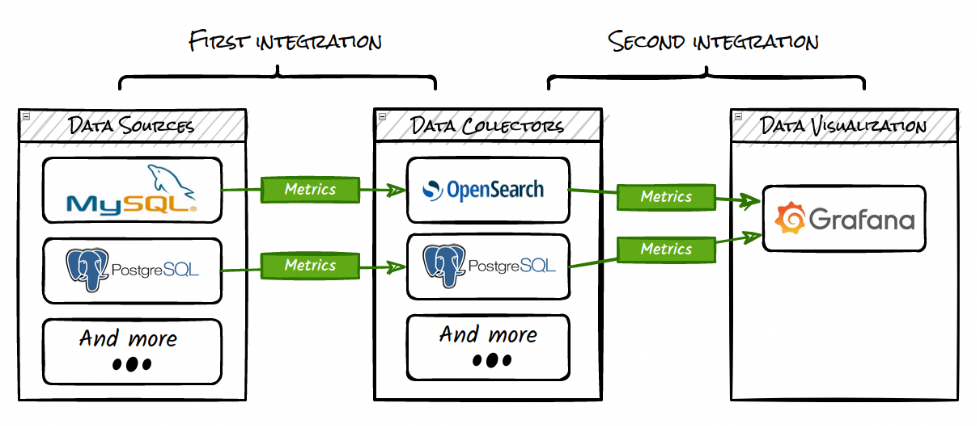
Concept
The Cross Service Integrations for Logs and Metrics allow you for example:
- To send Valkey or MySQL metrics in PostgreSQL.
- To send PostgreSQL or MySQL metrics to OpenSearch.
- To show metrics in Dashboards service.
For that you need:
- A source service
- A destination service
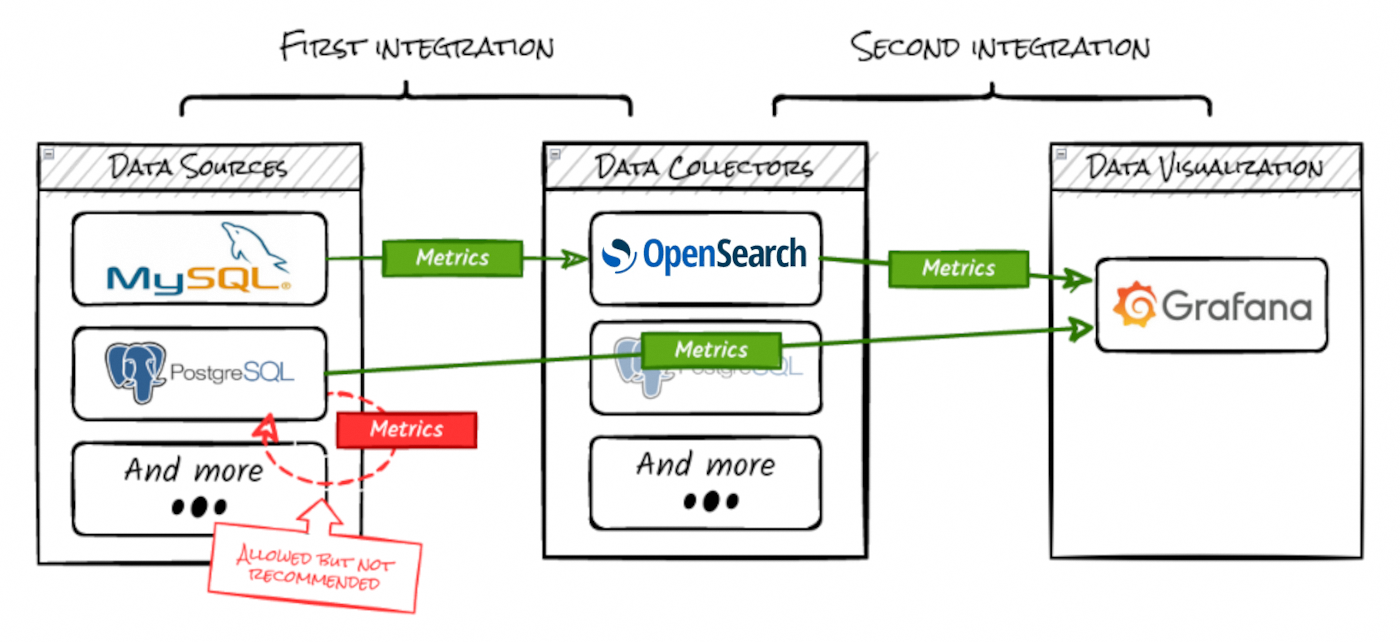
Although it is possible to define the same cluster as destination service and source service, this is a bad practice for multiple reasons (performance, security, resiliency, ...)
Integration matrix
- All services support logs to opensearch & kafka_logs to kafka.
- All services support metrics to pg.
Other integrations:
| source → ↓ destination | dashboards service | kafka |
|---|---|---|
| pg | dashboard, datasource | |
| opensearch | datasource | |
| kmm | kafka_mirrormaker | |
| kc | kafka_connect |
Instructions
Using the OVHcloud Control Panel
Store yours logs or metrics
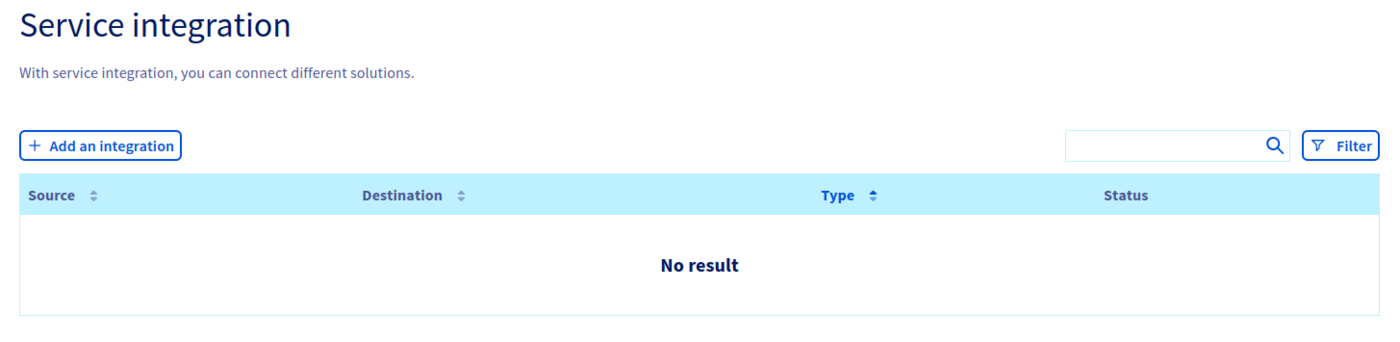
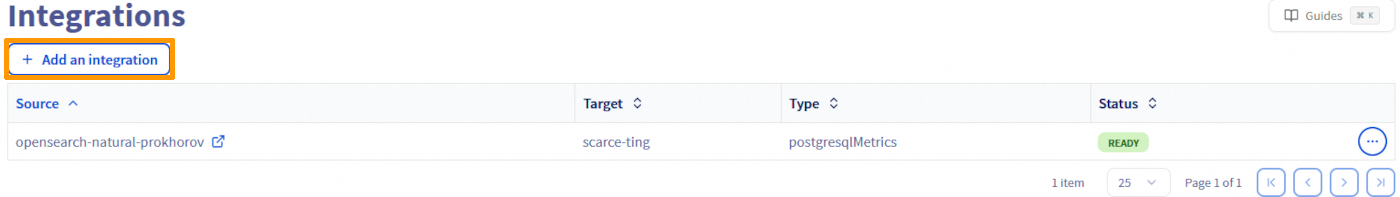
Click on Databases in the left-hand navigation bar, select your engine instance and open the Service integration tab.
Click on Add an integration:
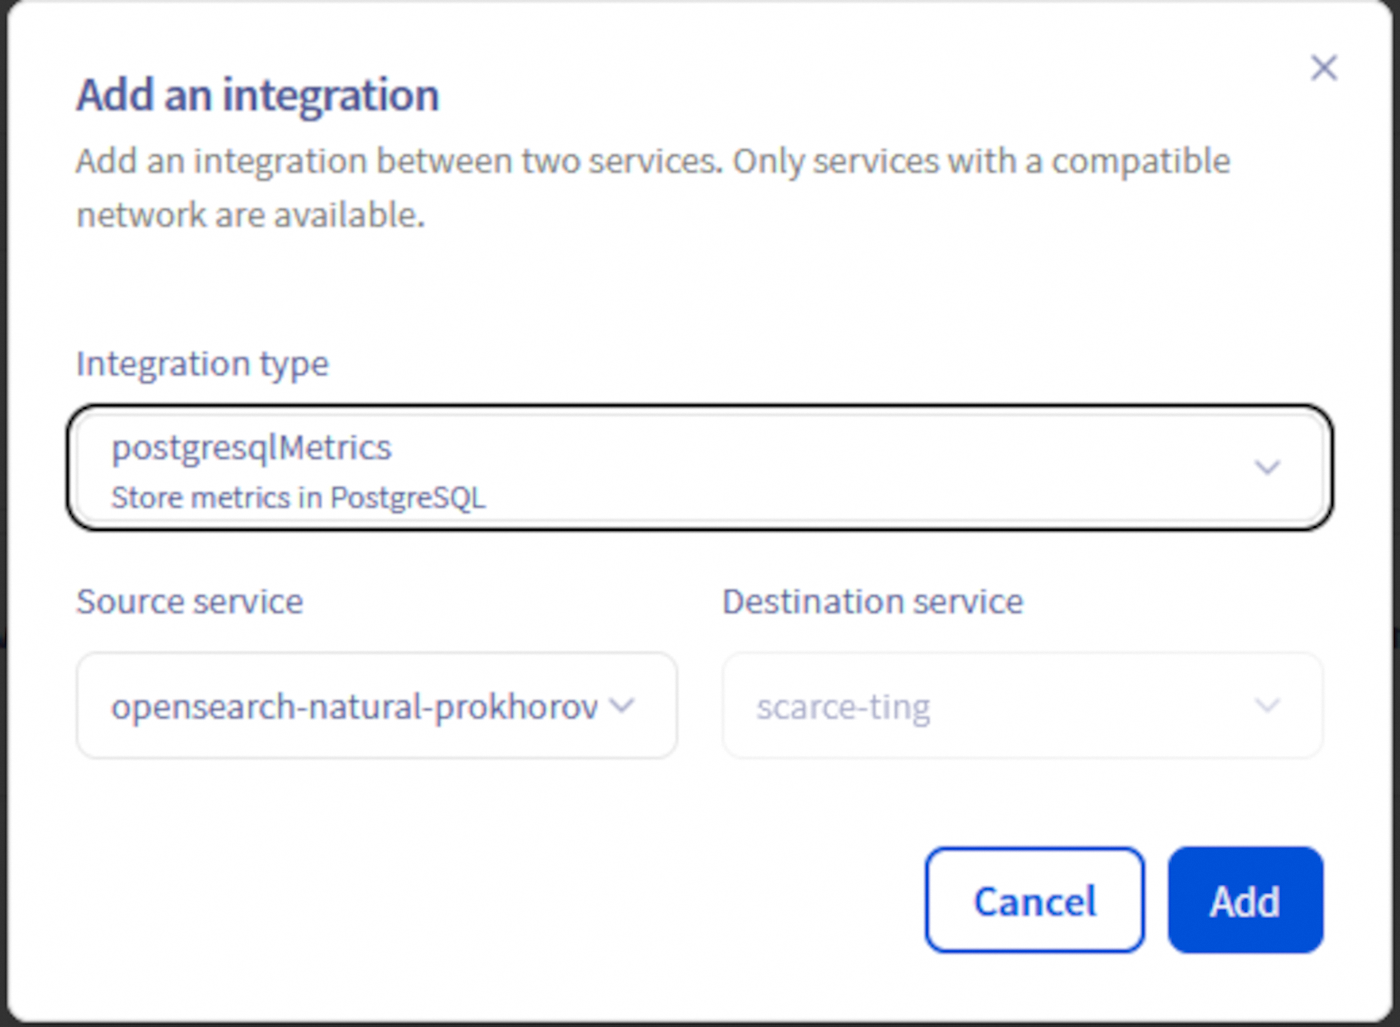
Define the Integration type and the Destination service:
First create a Public Cloud Database for your Destination service via your Control Panel or API.
Your first integration is ready:
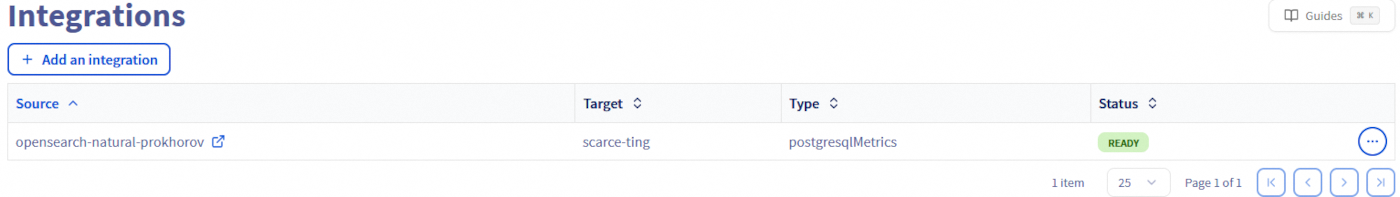
Note that this integration creation may have created two users, respectively: metrics_reader and metrics_writer in your engine instance.
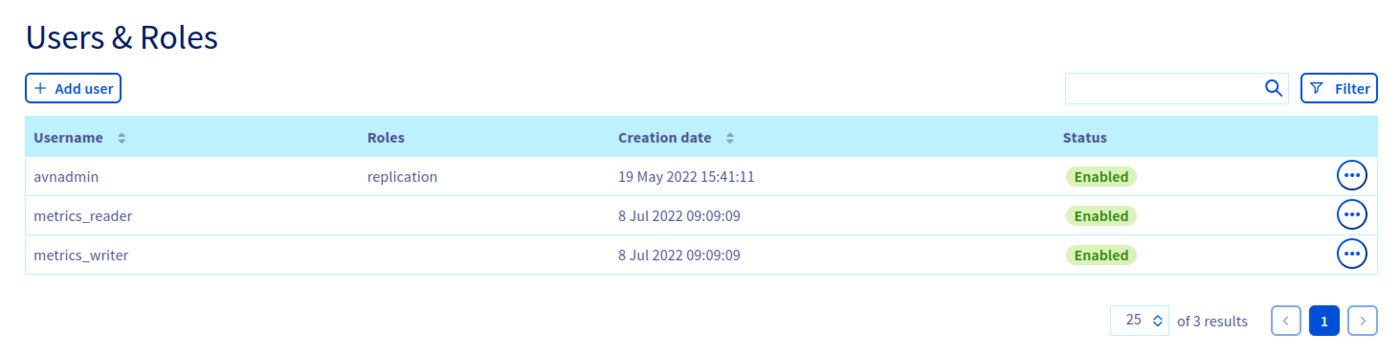
Don't delete them.
Allow metrics visualization into Dashboards service
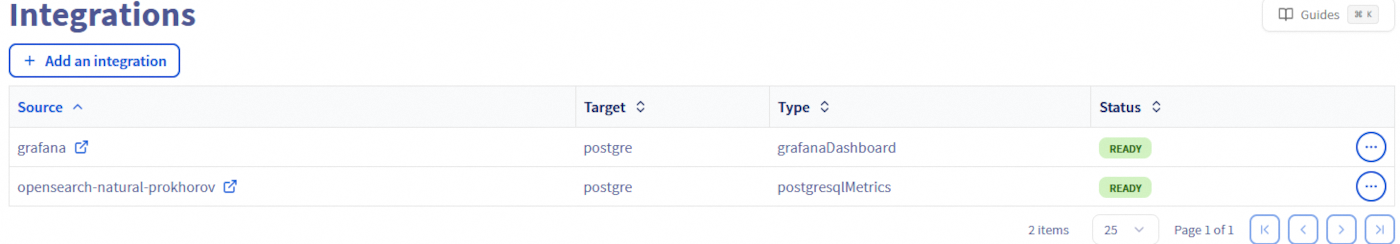
Go to the Service integration tab of your Destination service service and click on Add an integration
As you can see, the first integration is referenced.
Define grafanaDashboard as Integration type and the Source service:
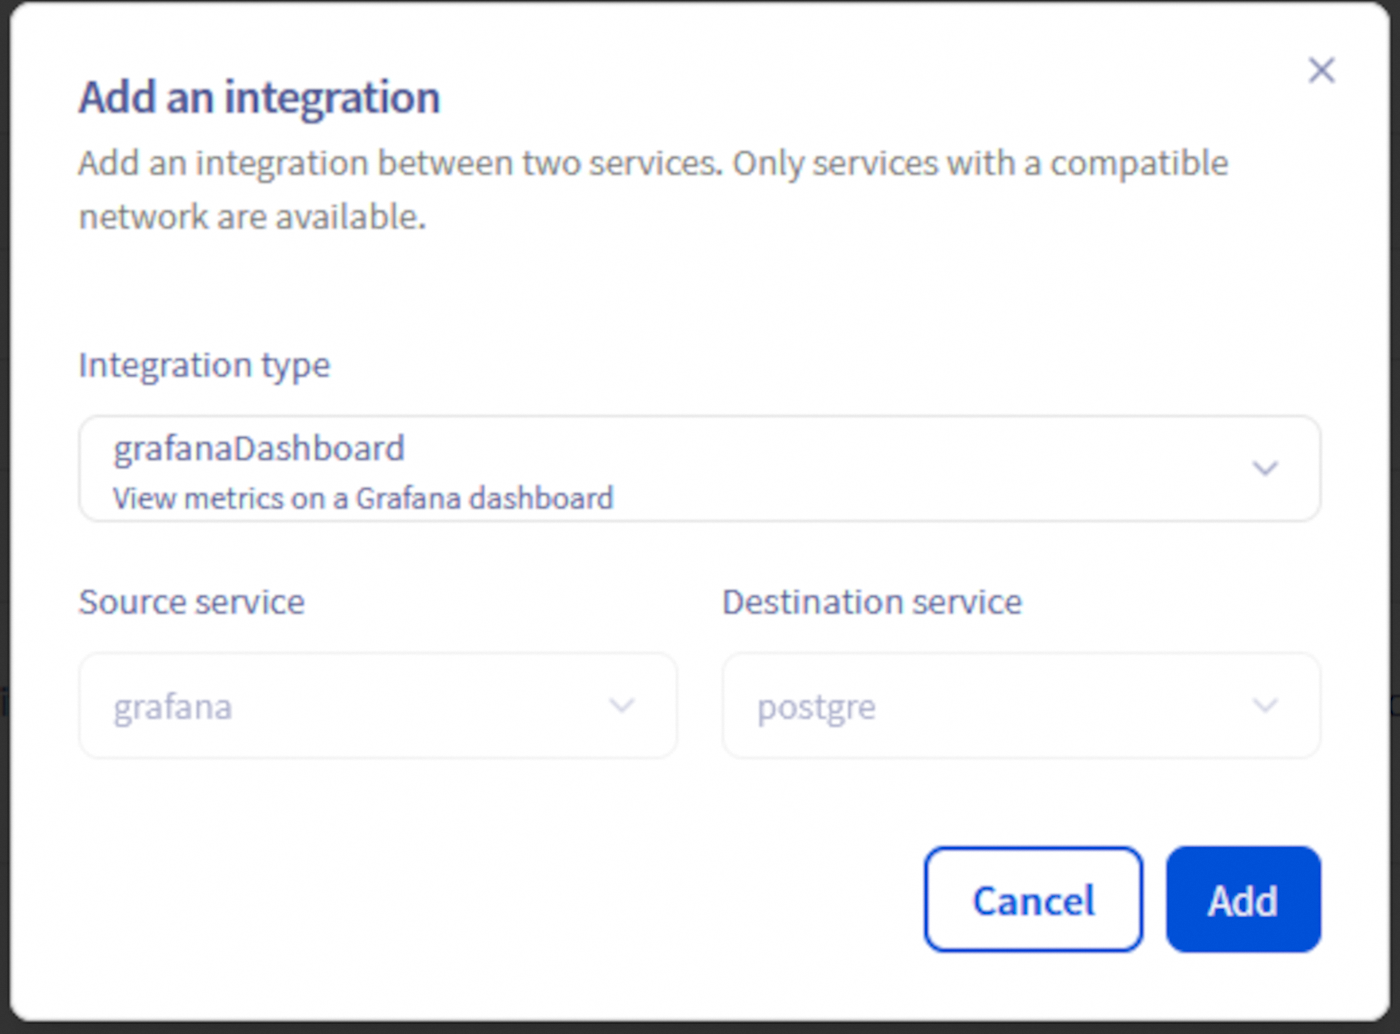
Your second integration is ready:
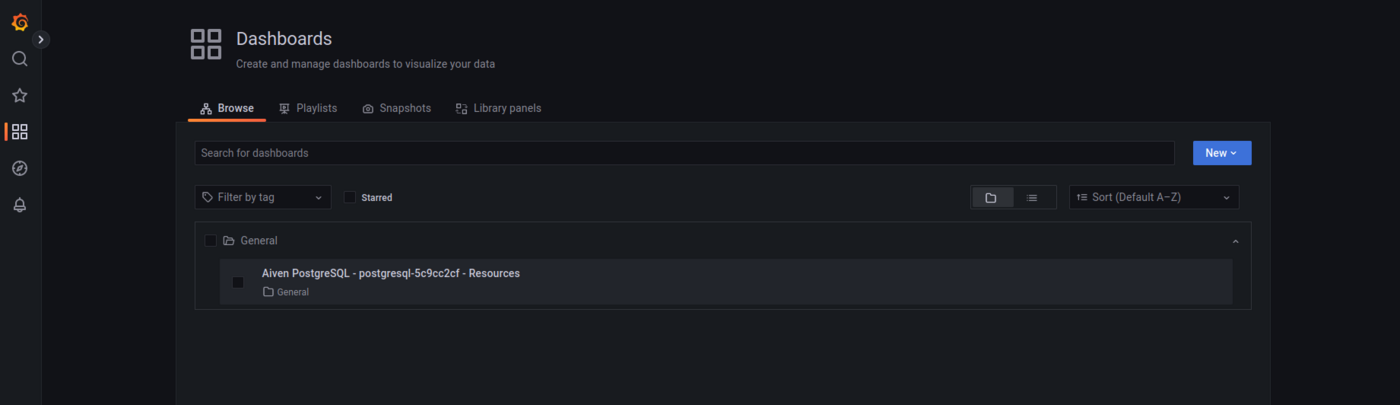
Connect to your Dashboards instance and browse the dashboards:
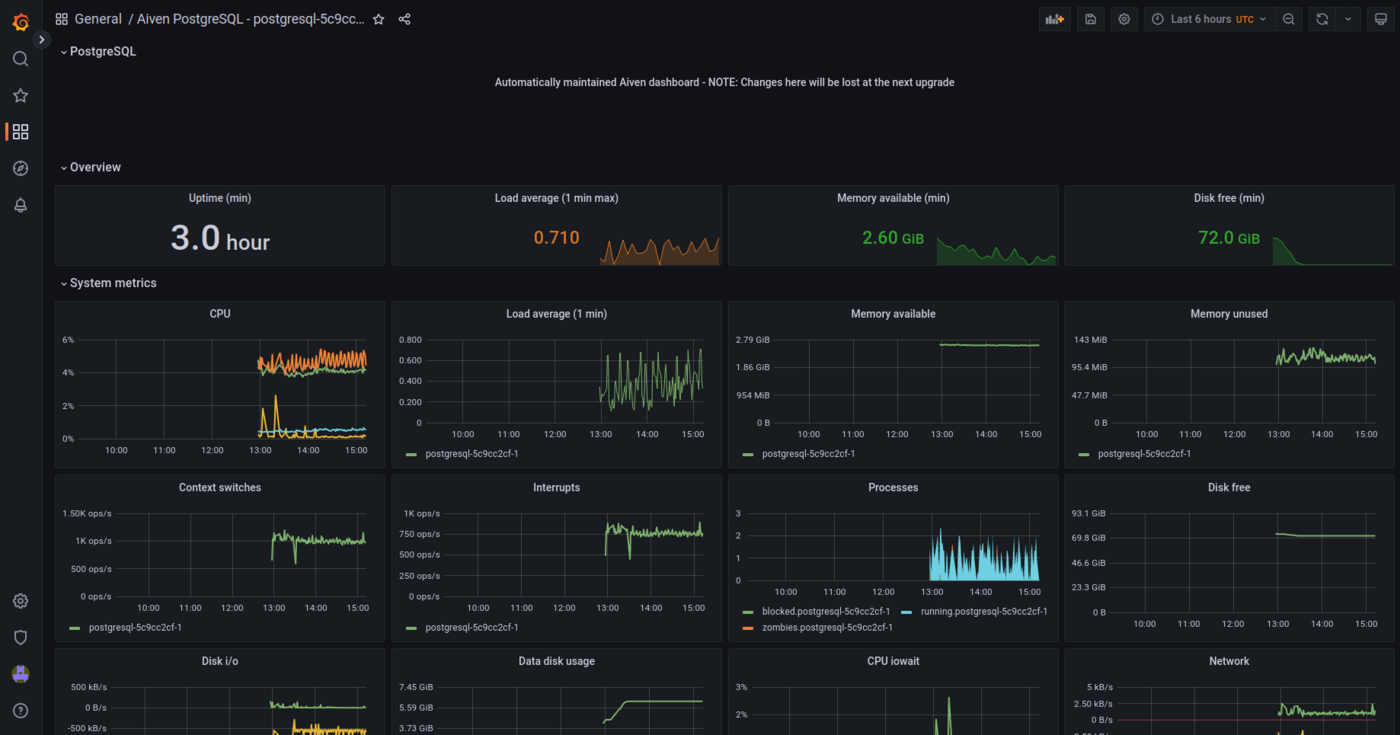
Then open your new dashboard:
Using API
If you are not familiar with using the OVHcloud API, please refer to our guide on First Steps with the OVHcloud APIs.
Get your service and cluster IDs
You first need to identify your serviceId and your clusterId.
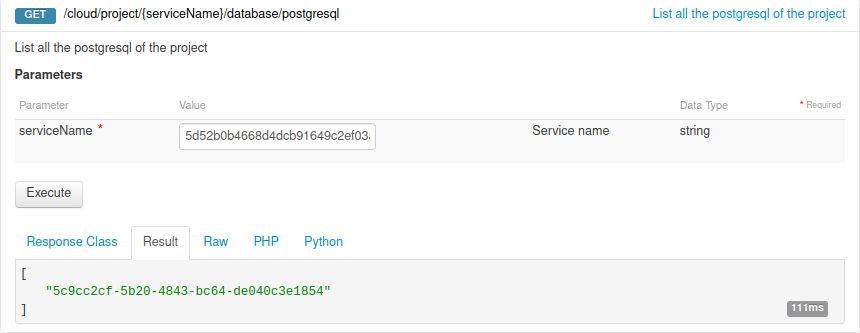
Get the desired service ID
Execute the following API call:
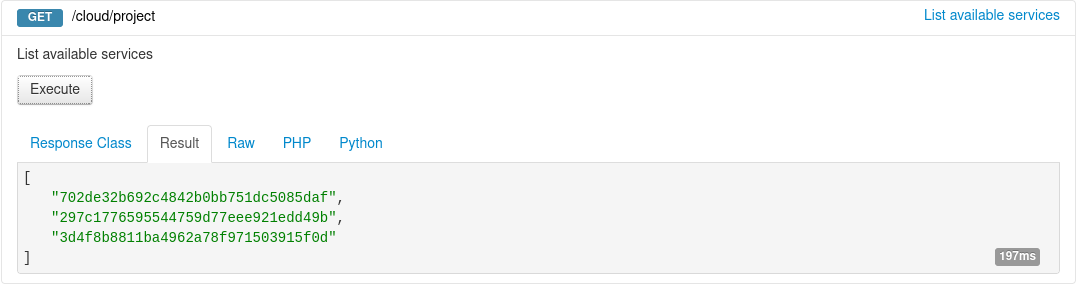
From the resulting list, select and copy the service identifier corresponding to the desired service, also known as serviceName.
Get the desired cluster ID
Open the following API call, paste your service ID into the serviceName input field and click Execute:
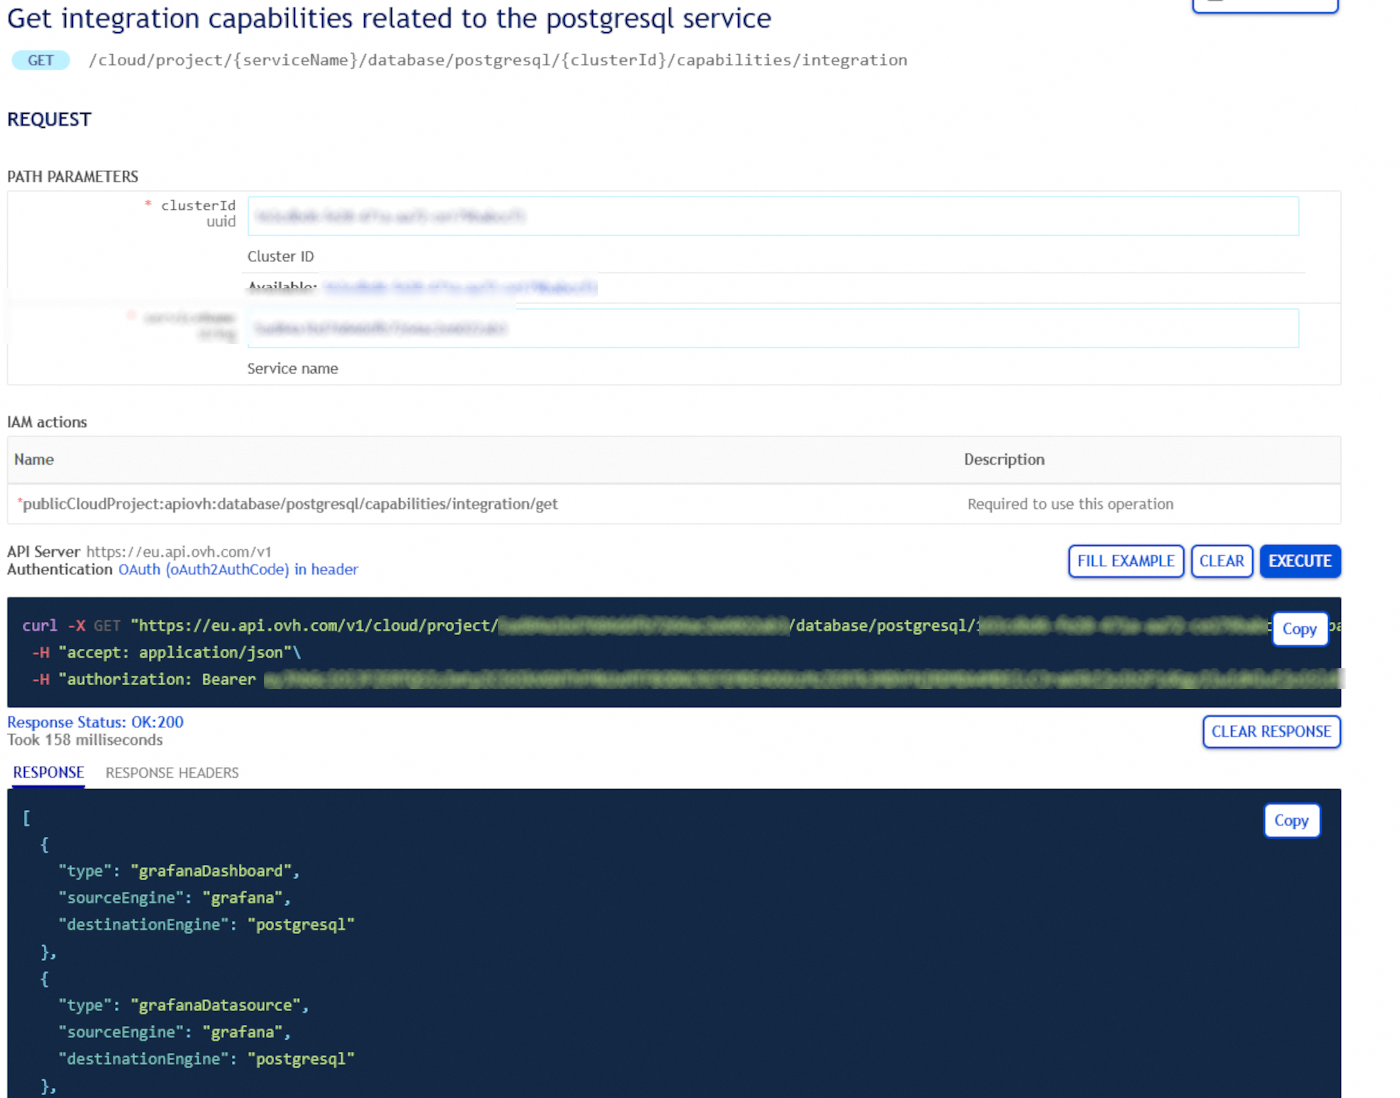
Get integration capabilities
Get integration capabilities related to your Public Cloud Databases service:
Store yours logs or metrics
As a first step, you need to push your metrics or logs somewhere, in order to store them and retrieve the metrics with Dashboards.
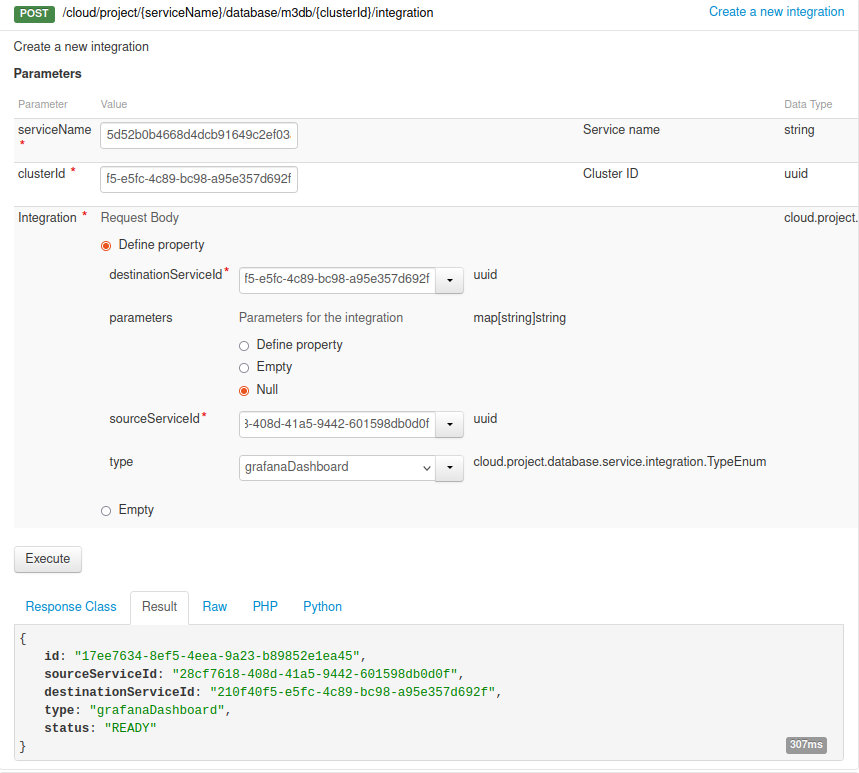
For that, you need to create a new integration:
Fill in the form with the information corresponding to the type of integration chosen.
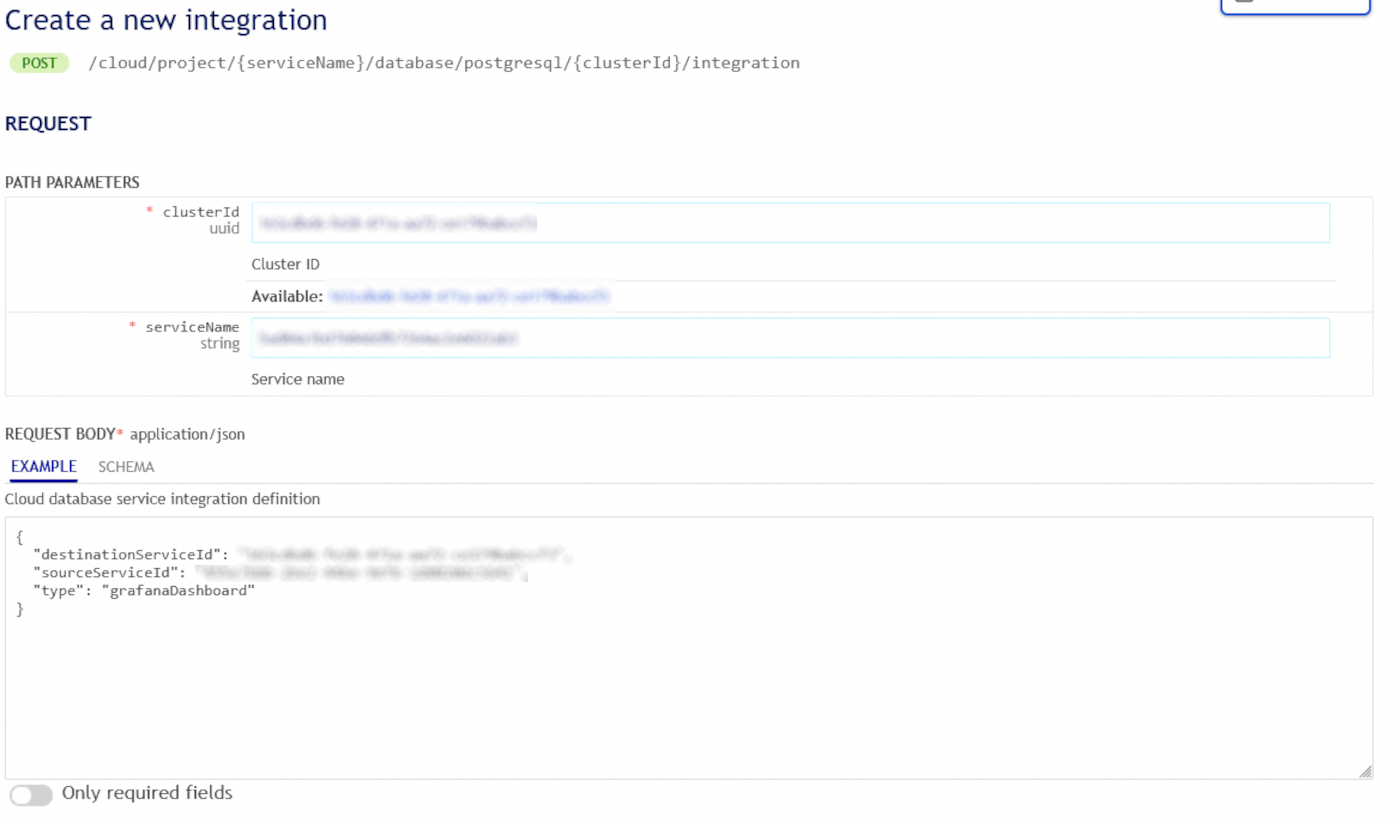
The destionationServiceId and the sourceServiceId correspond to the destination cluster ID and to the source cluster ID.
Allow metrics visualization into Dashboards service
Now that metrics are stored somewhere, you need to connect your Public Cloud Databases service to a Dashboards service.
For that, first create a Public Cloud Database for Dashboards via our Control Panel or API.
Once done, get the GrafanaDashboard integration capability related to the destination service:
Then create a second integration from your Destination service name:
Connect to your Dashboards instance and browse the dashboards:
Then open your new dashboard:
We want your feedback!
We would love to help answer questions and appreciate any feedback you may have.
If you need training or technical assistance to implement our solutions, contact your sales representative or click on this link to get a quote and ask our Professional Services experts for a custom analysis of your project.
Are you on Discord? Connect to our channel at https://discord.gg/ovhcloud and interact directly with the team that builds our databases service!

