Using Grafana with Logs Data Platform
67 Views
Objective
Grafana provides a powerful and elegant way to create, explore, and share dashboards and data with your team and the world. Since release 7, Grafana is able to communicate with OpenSearch and so allow you to mix data from Logs Data Platform and other data sources like IoT in the same place. This guide will show you how to achieve this.
Requirements
This is what you need to know to get you started:
- you are already sending logs on a stream you own see the quick start tutorial
- you have access to the port 9200 to your cluster (head to the Home page in manager to know the address of your cluster)
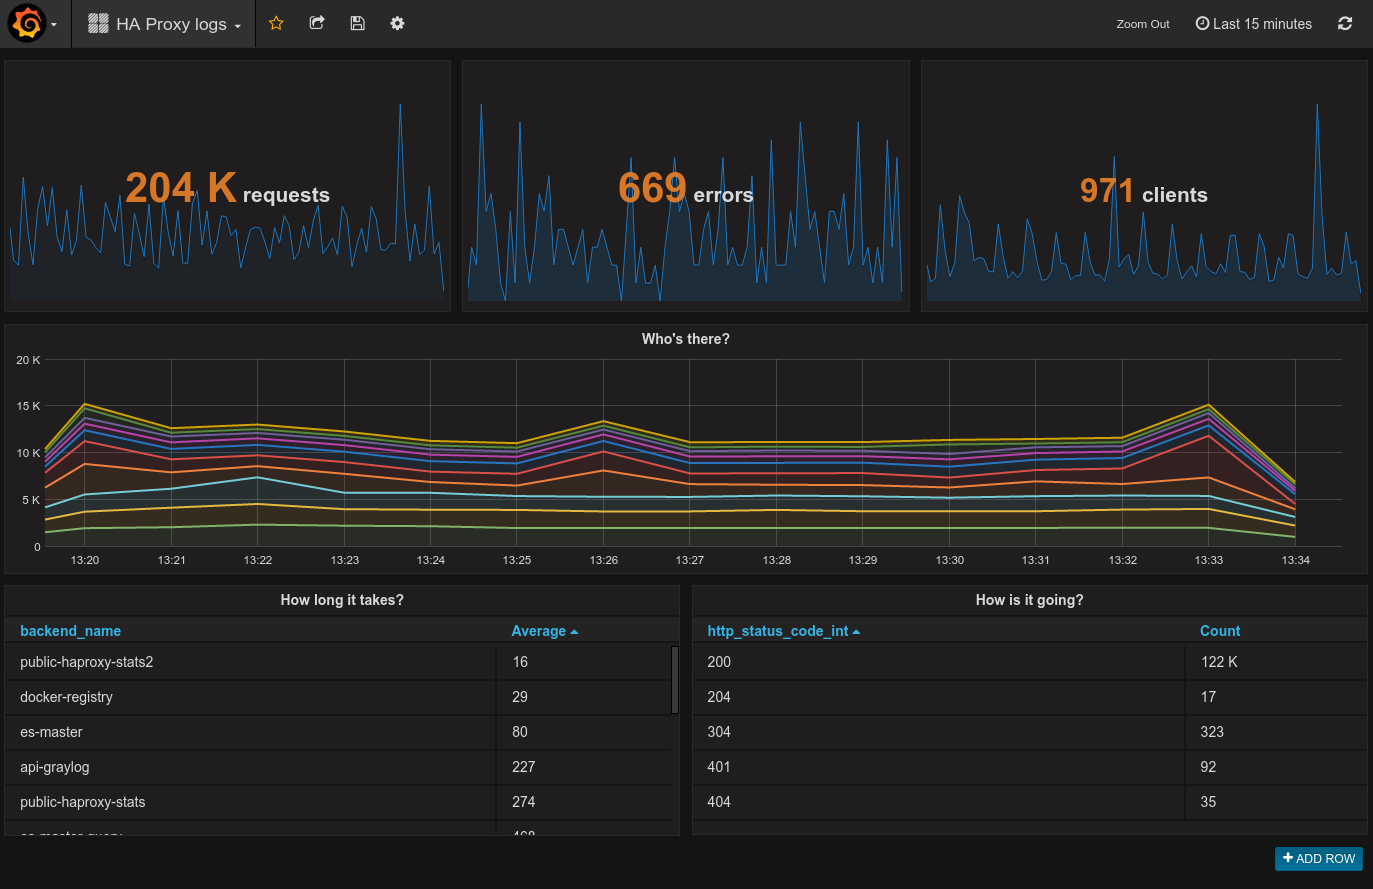
After some training you will be able to create this kind of dashboard:
OVHcloud Control Panel Access
- Direct link: Logs Data Platform
- Navigation path:
Identity, Security & Operations>Logs Data Platform> Select the platform concerned
Instructions
Select your Stream Alias
To access your logs from Grafana, you will need to setup an OpenSearch Alias and link them to your Graylog streams, so here we go again :
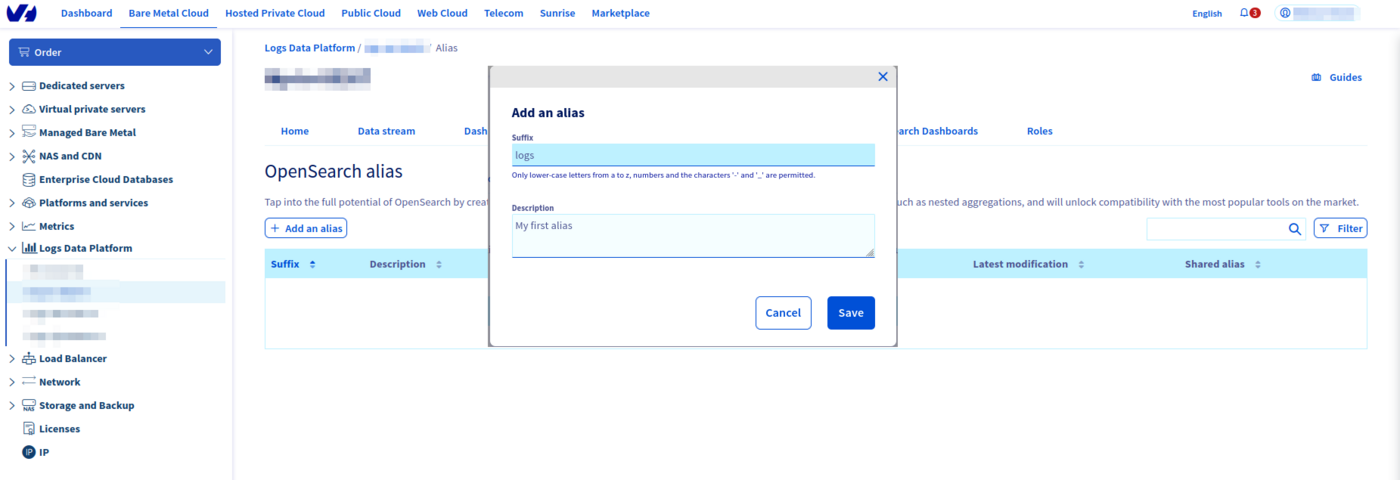
- In the
Aliastab, click on theAdd an aliasbutton - Choose a name and define a description for your alias
- Save the entry by clicking the
Savebutton - Once the alias has been created. Use the ... menu at the right and select
Attach content to the aliasoption. - Define there the graylog streams you want to associate to your alias
- That's it.
So here you go, now Logs Data Platform knows what stream you want to browse. Now let’s configure Grafana and see if it works!
Setup your own grafana
Get the latest Grafana release here: http://grafana.org/download/ (v9.0.0 at the time of writing). Then follow the Grafana installation guide according to your platform: http://docs.grafana.org/installation/
Launch it!
If everything is setup properly, launch your favorite browser, and point it to http://localhost:3000 Once logged in with your grafana credentials, reach data sources panel to setup your Logs Data Platform datasource:
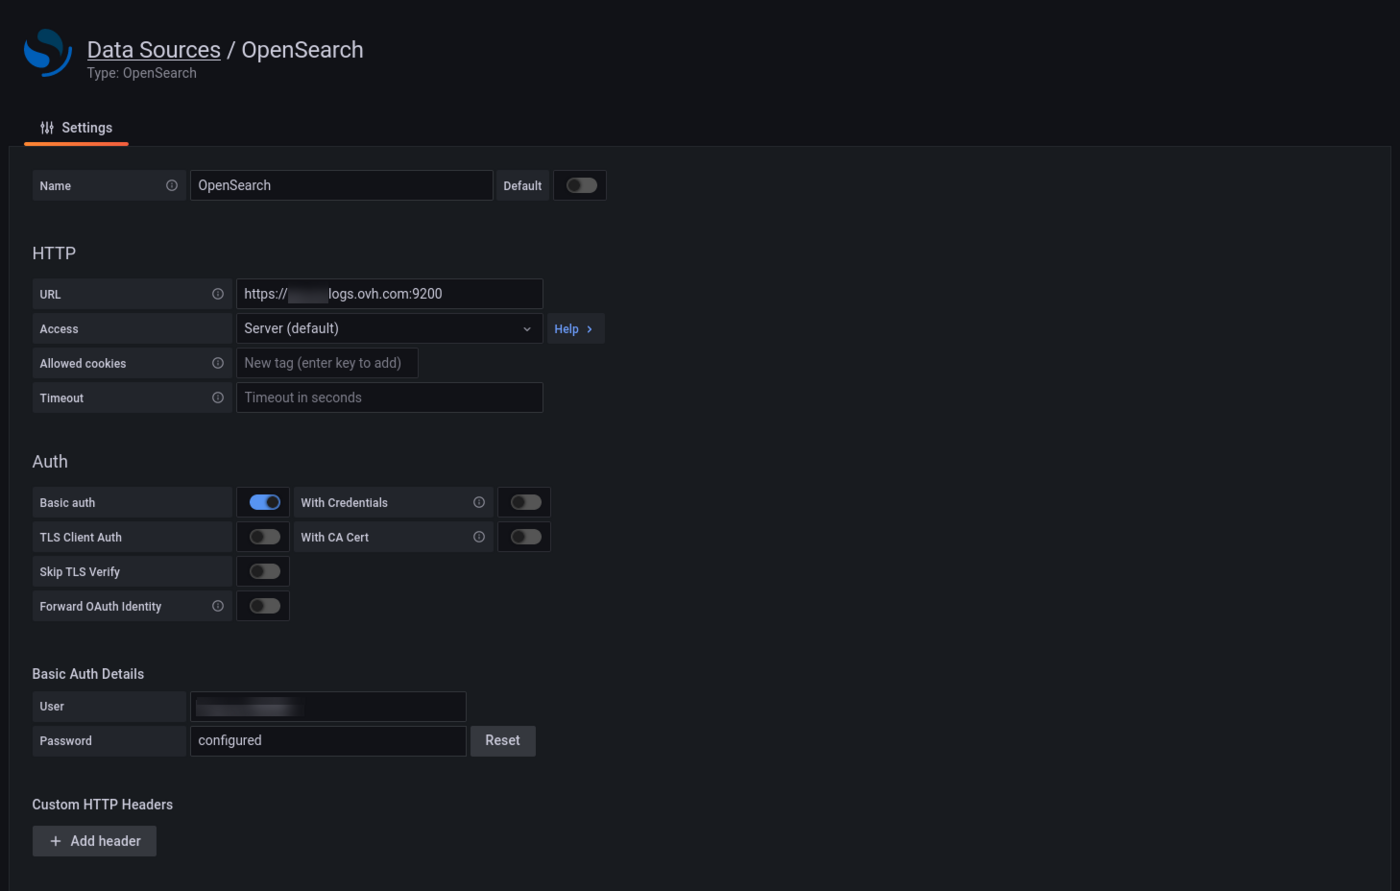
To make the magic happen, please ensure to:
- Set
https://<your_cluster>.logs.ovh.com:9200as URL value - Set your Logs Data Platform credentials for Basic auth values
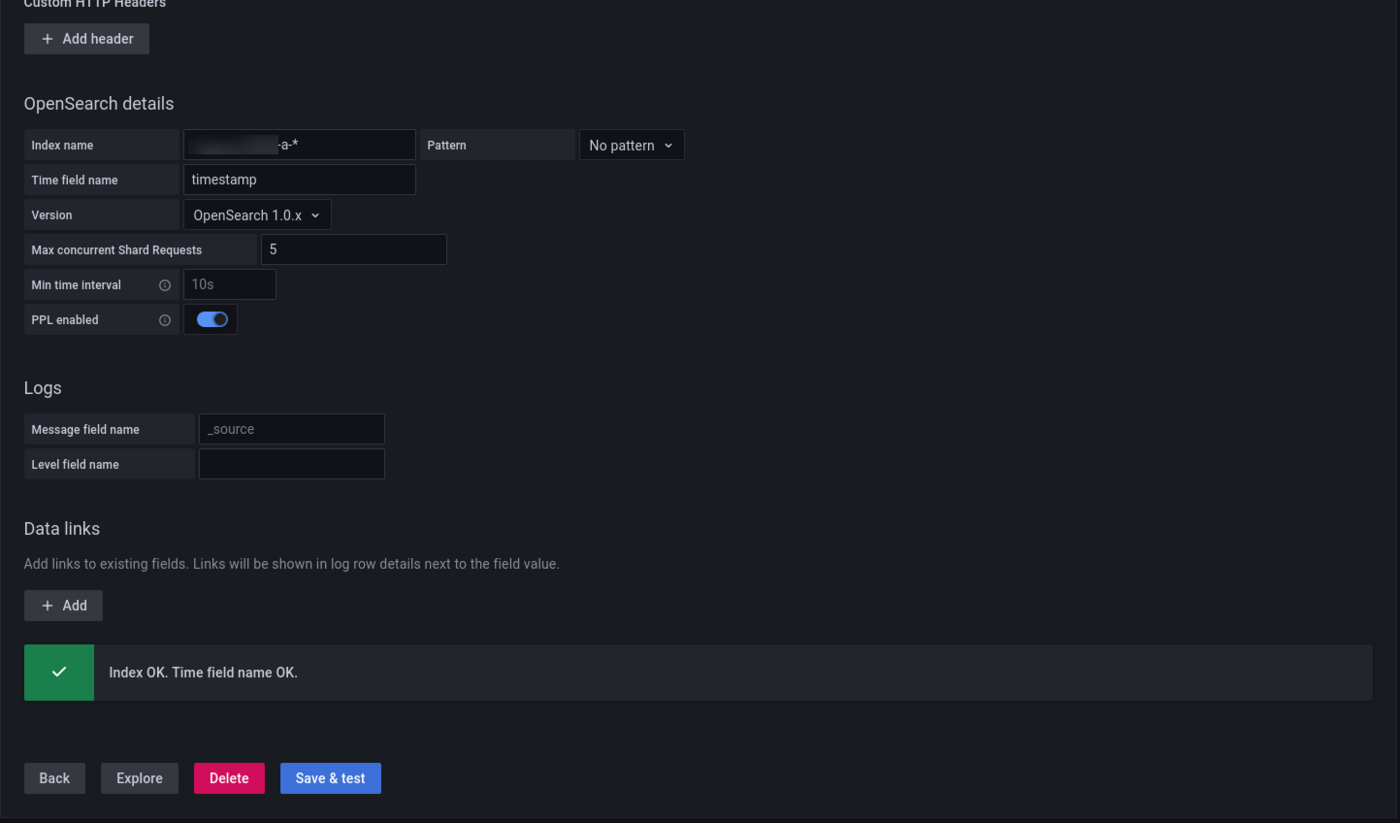
- Set the Index name as the Logs Data Platform alias linked to Grafana
- Change default Time field name to timestamp
- Set the Version by clicking
Get Version and Save. - Register your data source and test it.
If your configuration is correct, it should display: " Index Ok. Timefield Ok."
To explore further, you can create a new dashboard and add different styles of visualizations. If you want to know what you can do with Grafana and OpenSearch, read the official documentation.
Go further
- Getting Started: Quick Start
- Documentation: Guides
- Community hub: https://community.ovh.com
- Create an account: Try it!

