Exchange - How to manage logs
53 Views
Objective
Logs correspond to events that occur on a computer system (server, computer, application, website, database, network, etc.). For example, logs can record and contain one or more of the following elements:
- The timestamp (date, hour, minute, second) of the event.
- The nature of the event (login, logout, error, download, upload, alert, etc.).
- Additional information about the event (pages or files accessed, applications launched, remote servers called, name of a file uploaded or downloaded, etc.).
- The origin of the event (user identifier, source IP address, source program, etc.).
- The state of the system at the time of the event (available resources, remaining memory, CPU usage, etc.).
Generally, logs are generated directly by the computer systems on which the events occur. They are stored and archived in text files also known as log files.
Log files allow you to perform the following actions:
- Analyse the behaviour of the computer system generating the logs.
- Identify errors that have occurred on the computer system.
- Resolve errors encountered on the computer system.
- Optimise the operation and performance of the computer system.
Your Private Exchange or Trusted Exchange offer therefore generates its own logs. You may need to consult or retrieve the logs to analyse access to your email inboxes or to track email flows.
Discover how to view and manage logs on your Private Exchange or Trusted Exchange offer.
Requirements
- You have subscribed to a Private Exchange or Trusted Exchange offer.
- You have a Logs Data Platform (LDP) account. This guide will guide you through all the necessary steps: Quick start for Logs Data Platform.
OVHcloud Control Panel Access
- Direct link: Exchange
- Navigation path:
Web Cloud>Exchange> Select your platform
Instructions
View your Exchange platform logs in real-time
To access real-time logs on your Private or Trusted Exchange offer, to the right of the series of tabs, click on the More + tab and then on Logs.
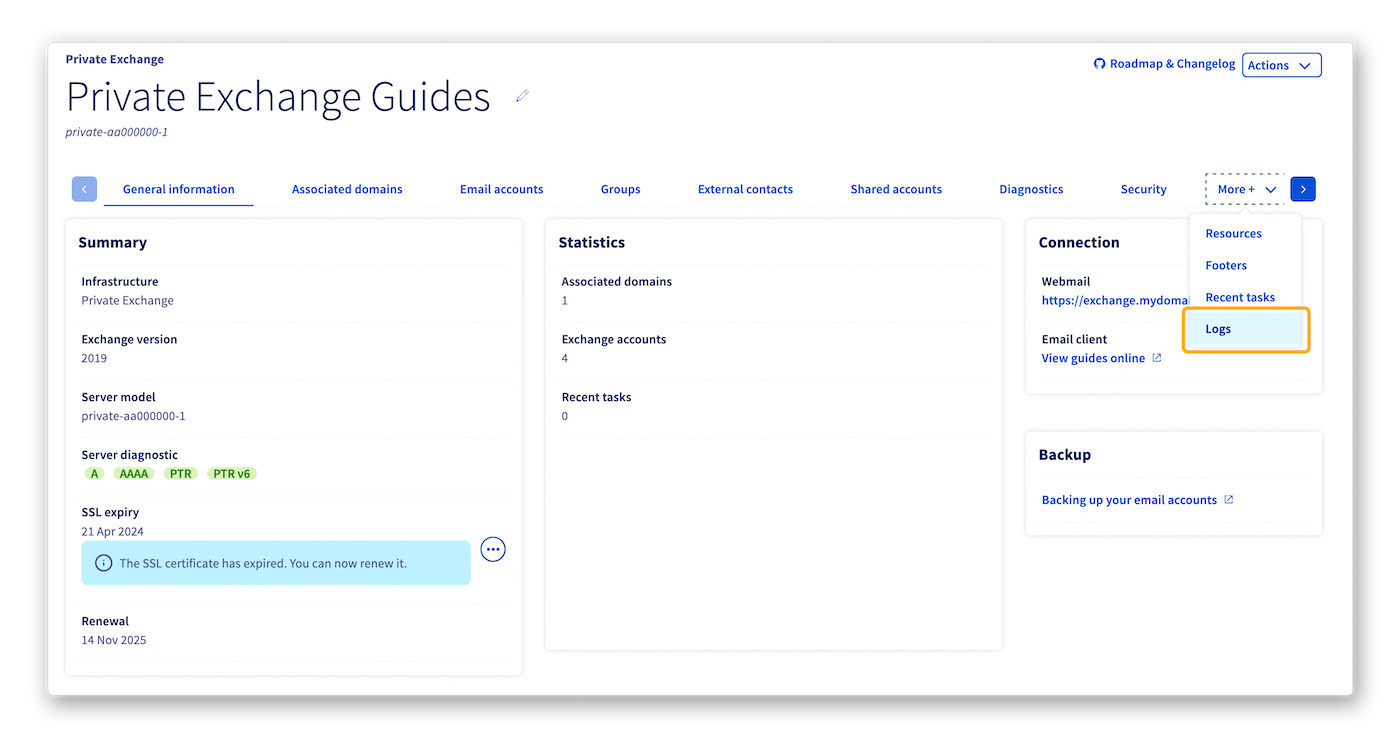
As this is a real-time console, logs only appear when you are on the Logs tab. If you leave the Logs tab and return to it, the previous history will have disappeared.
Exchange services offer two types of logs:
- Access: Allows you to view the activity of connections on your Exchange service.
- Messagetracking: Allows you to view detailed logs of the email flows through your Exchange service. You will find the following information:
- Delivery status of emails on your Exchange accounts
- Sending status of emails from your Exchange service
- Size of transmitted emails
- etc.
Integrate your Exchange solution logs on Logs Data Platform
The Logs Data Platform solution can be useful if you have a large infrastructure or if your services generate a large amount of logs. Indeed, this platform is designed to facilitate the aggregation and management of logs.
It works by retrieving logs generated by your infrastructure, websites or applications to, for example:
- Store them.
- Display them in real-time dashboards.
- Allow users to perform complex queries.
- Filter them by date, application, type or content.
For more details on Logs Data Platform, consult our introduction guide to Logs Data Platform.
Exchange solutions are compatible with various services such as web hosting, VPS and dedicated servers. They can also be complemented by data streams on Logs Data Platform, in addition to the real-time logs already available.
To subscribe your Exchange solution logs to a data stream on Logs Data Platform, perform the following actions:
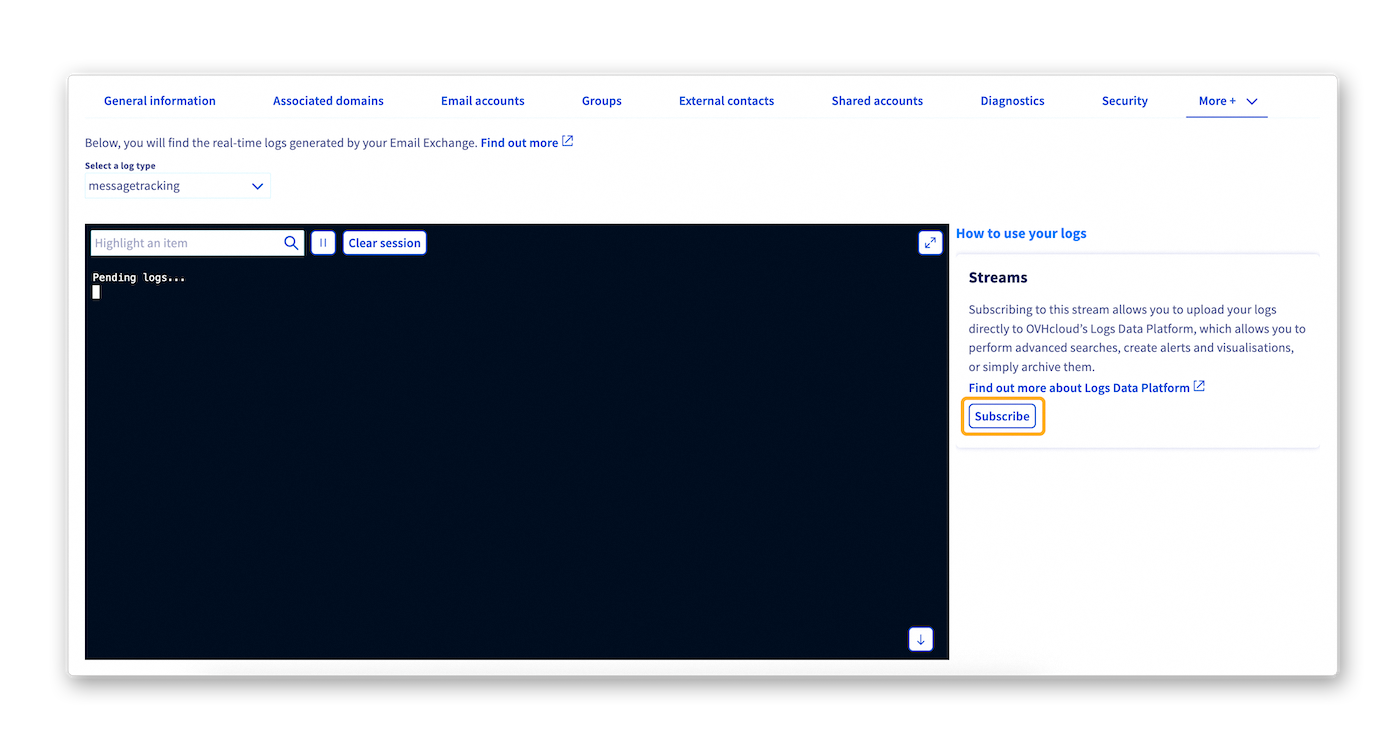
- To the right of the series of tabs, click on the
More +tab and then onLogs. - On the right side of the box where your real-time logs are displayed, click on the
Subscribebutton.
From the page that appears, select the desired Logs Data Platform account in the drop-down menu located above the table.
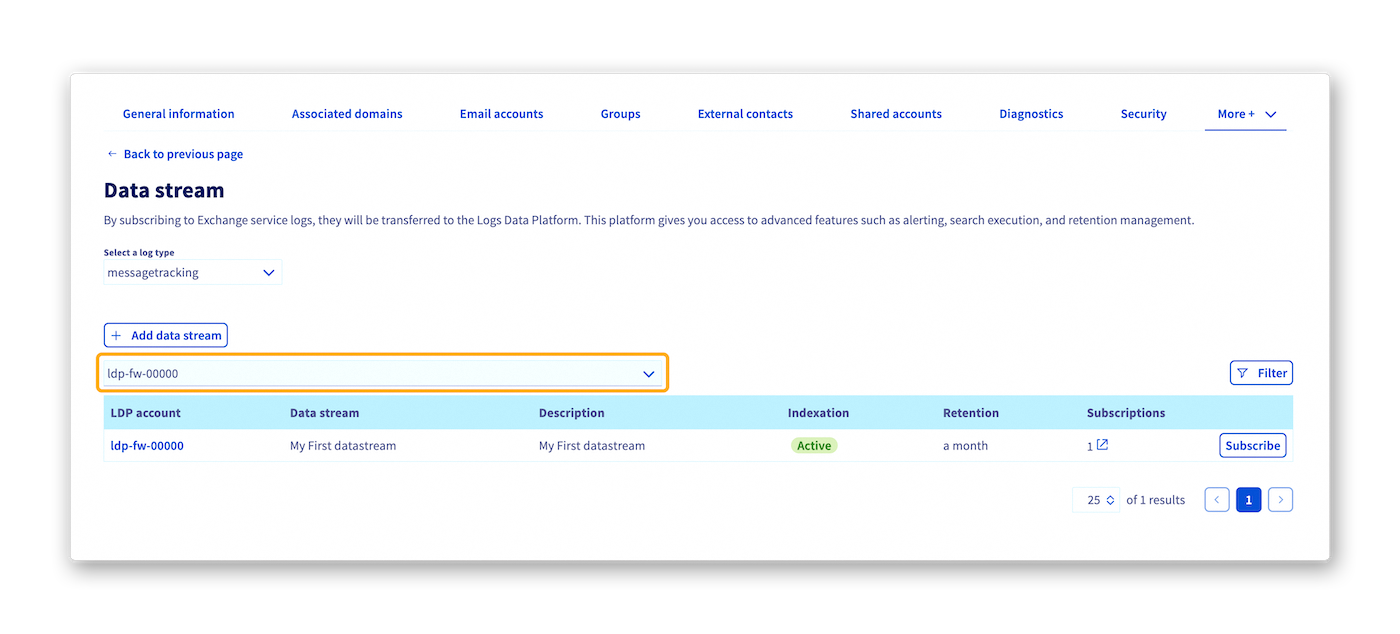
Two scenarios are then available to subscribe your Exchange solution:
Subscribing to an existing data stream on your Logs Data Platform solution
If the relevant stream already exists, it appears as a line in the table. In this specific case, to subscribe your Exchange solution to this existing stream, simply click on the Subscribe button located to the right of the line corresponding to the relevant stream.
After a few moments a message appears in your Control Panel on the same page to inform you that the subscription has been successfully created.
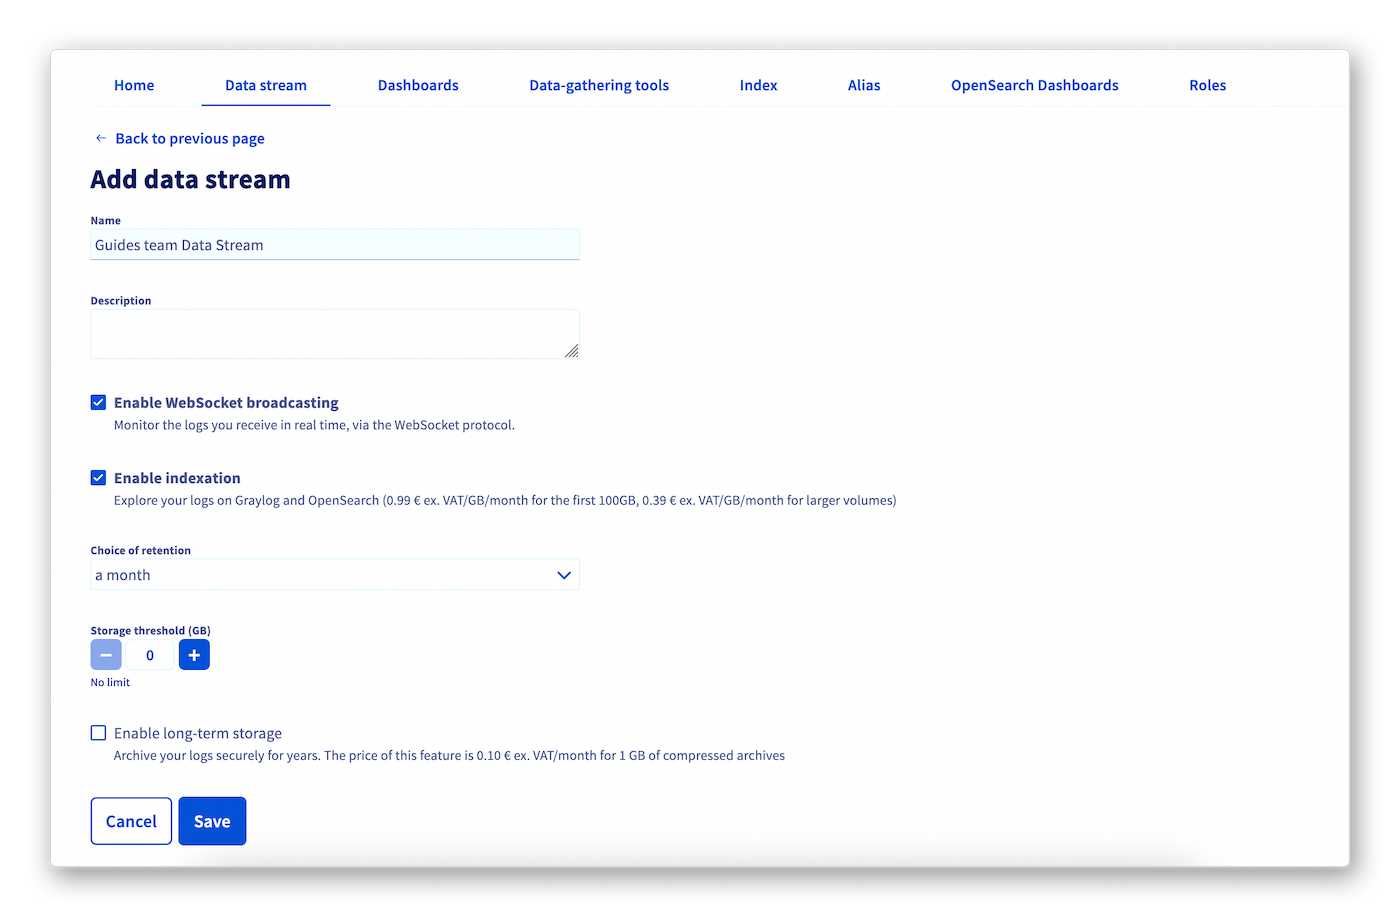
Subscribing to a new data stream on your Logs Data Platform solution
If the relevant stream does not yet exist, click on the Add a data stream button. You will then be redirected to a new page in your OVHcloud Control Panel, where you can create a new data stream on your Logs Data Platform solution.
Refer to our guides Introduction to Logs Data Platform and Quick start for Logs Data Platform to perform this action.
Once the form is completed, click on the Save button.
You will then be redirected to the Data stream tab of your Logs Data Platform solution.
You can now subscribe your Exchange solution to your new Logs Data Platform stream by following the instructions above.
Go further
For specialised services (SEO, development, etc.), contact OVHcloud partners.
Getting started with the Private Exchange service
Introduction to Logs Data Platform
Quick start for Logs Data Platform
If you would like assistance using and configuring your OVHcloud solutions, please refer to our support offers.
Join our community of users.

