Deploying a monitoring stack (Prometheus & Grafana) in a Kubernetes cluster in MRS
716 Views
Objective
Managed Rancher Service by OVHcloud provides a powerful platform for orchestrating Kubernetes clusters seamlessly.
This guide will show you how to deploy, in Rancher, a monitoring stack (Prometheus & Grafana) to monitor your Kubernetes cluster.
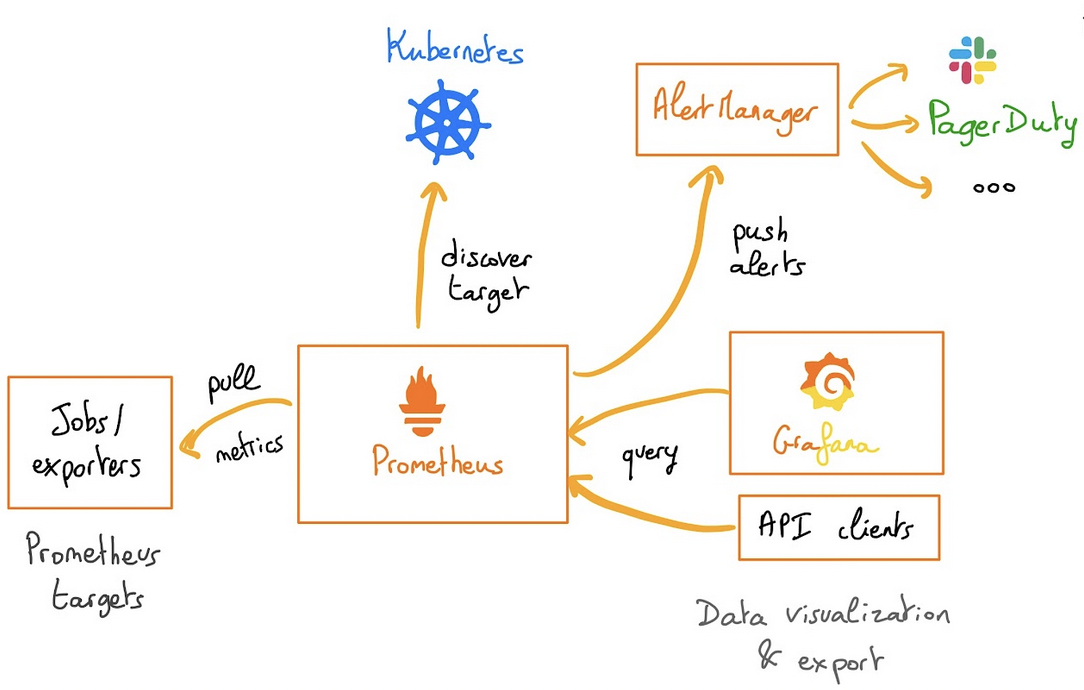
The rancher-monitoring operator is powered by Prometheus, Grafana, Alertmanager, the Prometheus Operator, and the Prometheus adapter.
The monitoring application allows you to:
- Monitor the state and processes of your cluster nodes, Kubernetes components, and software deployments
- Define alerts based on metrics collected via Prometheus
- Create custom Grafana dashboards
- Configure alert-based notifications via Email, Slack, PagerDuty, etc. using Prometheus Alertmanager
- Define precomputed, frequently needed or computationally expensive expressions as new time series based on metrics collected via Prometheus
- Expose collected metrics from Prometheus to the Kubernetes Custom Metrics API via Prometheus Adapter for use in HPA
Requirements
- A Public Cloud project in your OVHcloud account
- An OVHcloud Managed Rancher Service (see the creating a Managed Rancher Service guide for more information)
- An access to the Rancher UI to operate it (see the connecting to the Rancher UI guide for more information)
- A Kubernetes cluster created or imported in Rancher
Instructions
In this guide you will deploy the monitoring Helm chart that is based on the upstream kube-prometheus-stack chart. The chart deploys Prometheus Operator and its CRDs along with Grafana, Prometheus Adapter and additional charts / Kubernetes manifests to gather metrics. It allows users to monitor their Kubernetes clusters, view metrics in Grafana dashboards, and set up alerts and notifications.
Install the monitoring stack (Prometheus & Grafana)
Log in to your Managed Rancher Service UI.
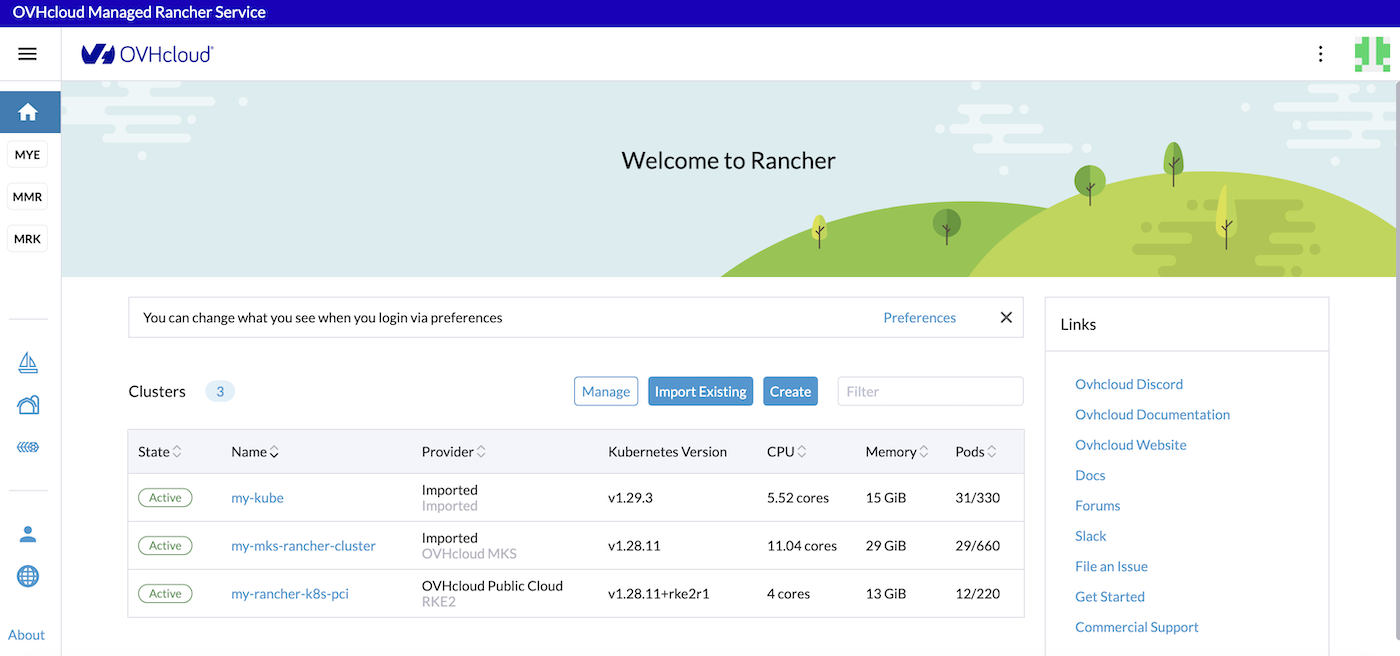
Click on the name of your cluster.
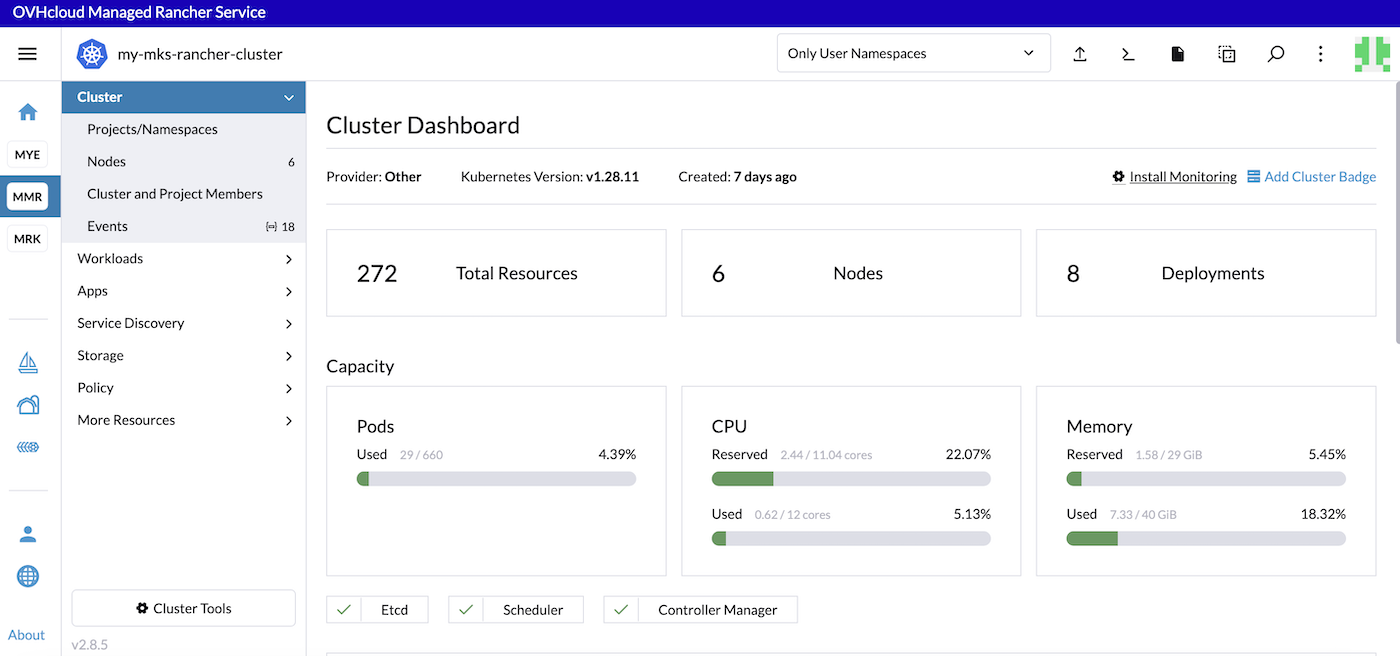
Click on Install Monitoring.
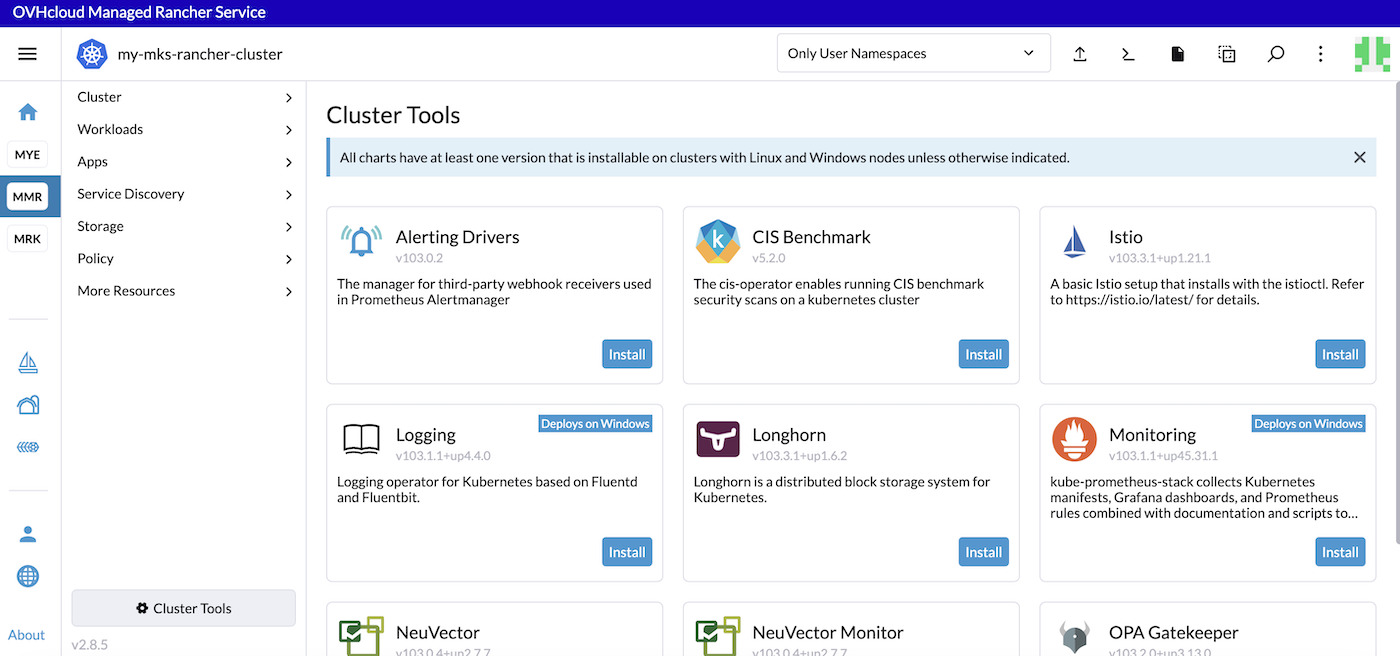
Click on Install in the Monitoring app to install Prometheus.
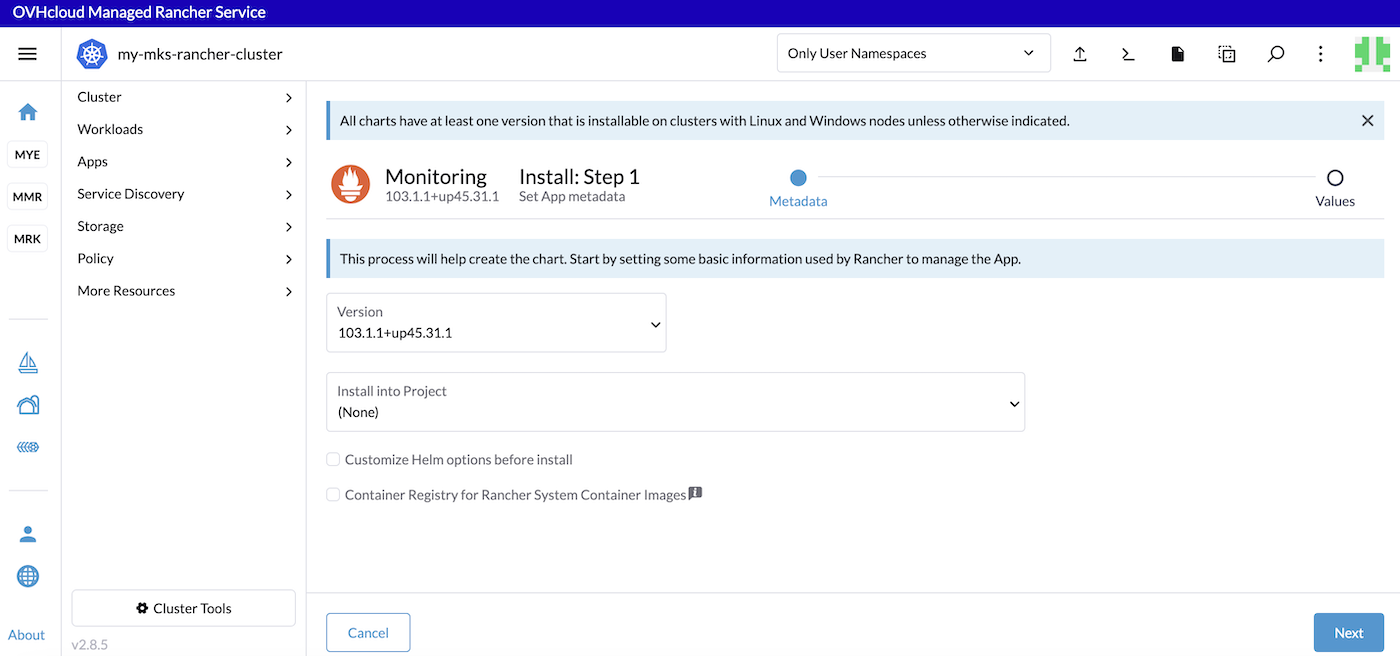
You can customize Helm chart options if you want by ticking the Customize Helm options before install checkbox.
Click the Next button to jump into the second step.
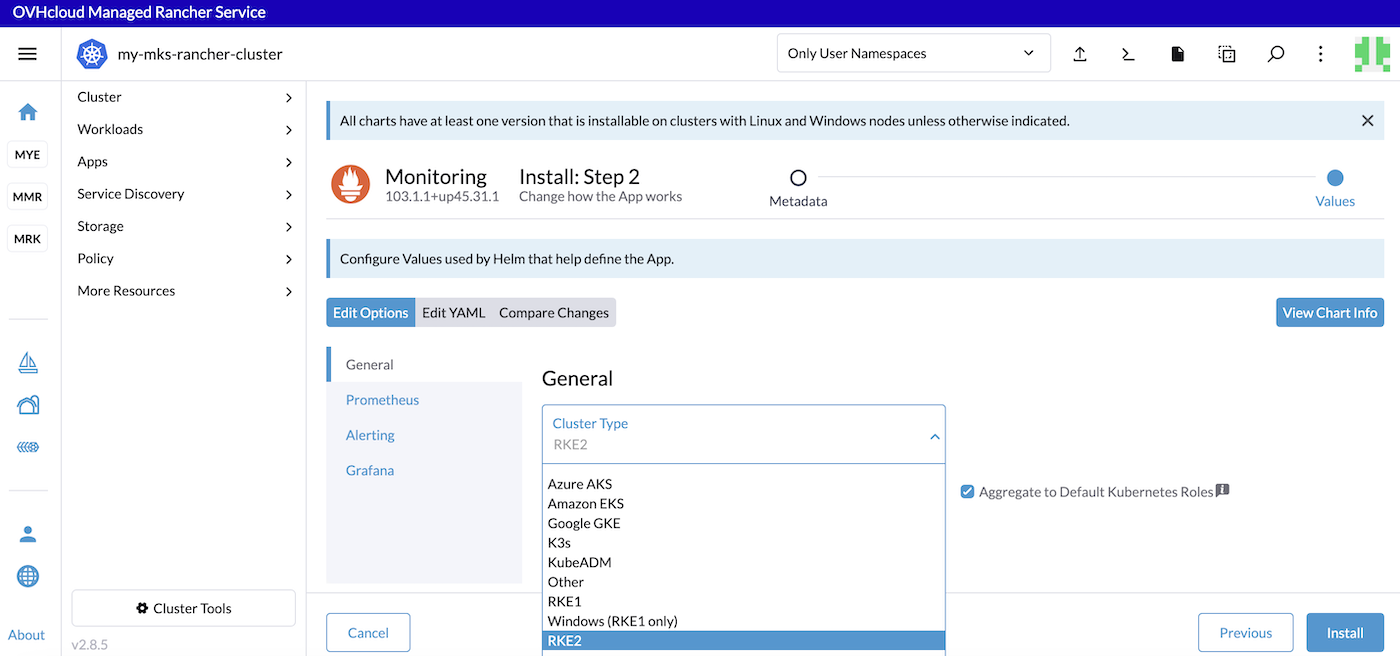
Choose the Cluster Type.
Select K3s or RKE2 if you installed the Kubernetes cluster nodes with Rancher or Other for a MKS cluster.
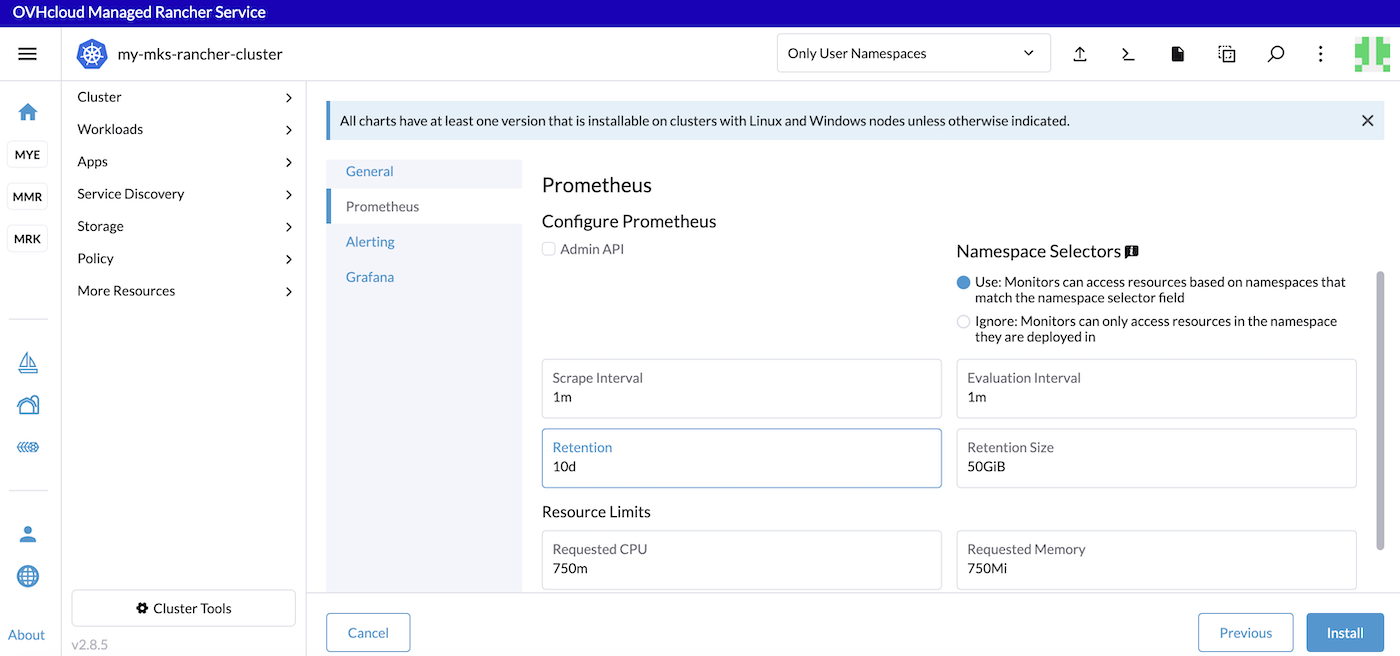
In the Prometheus tab you can configure scrapping intervals, retention and resource memory and limits.
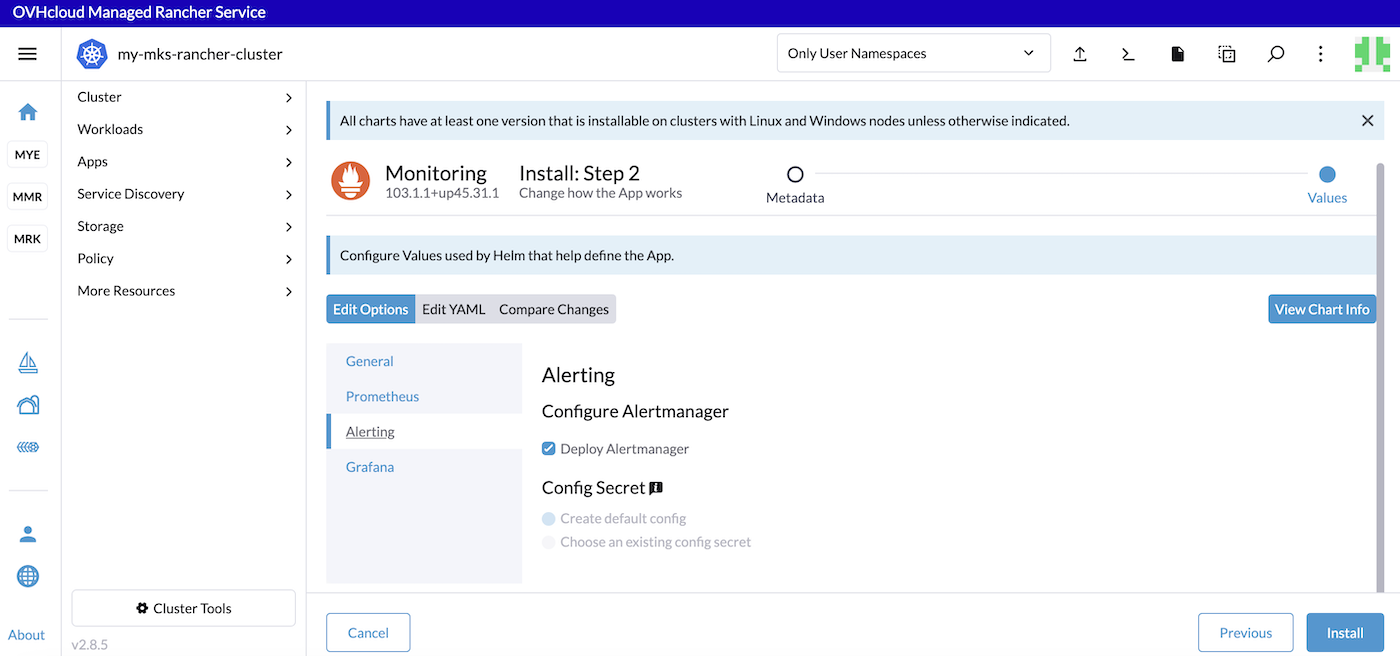
In the Alerting tab you can configure and deploy Alertmanager.
In the Grafana tab you can view the chart info and configure Grafana storage.
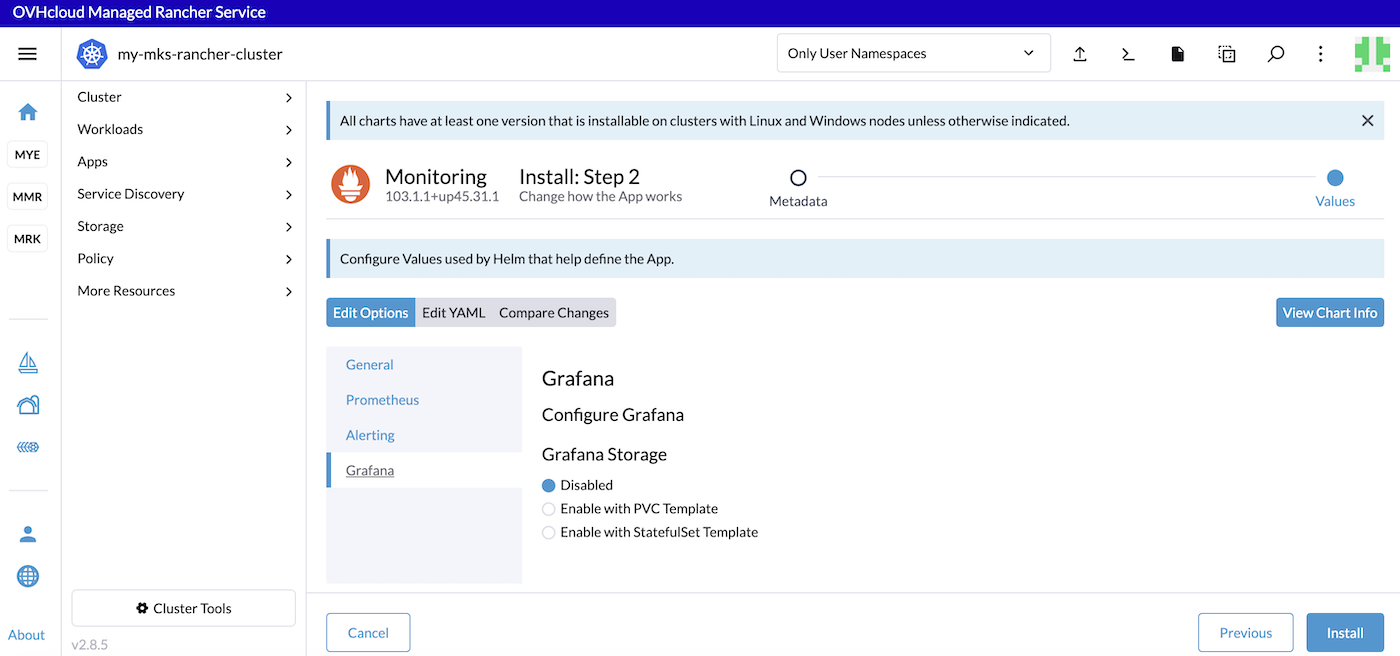
Click the Install button to install the monitoring stack.
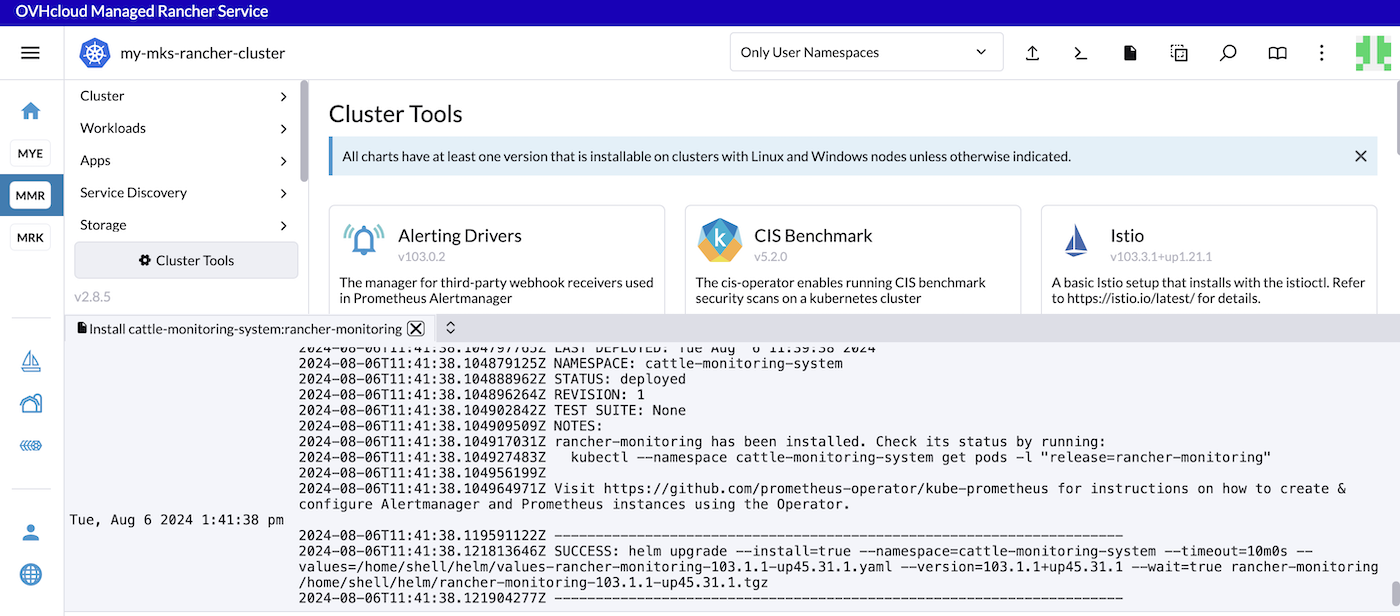
The Logs will be displayed and showing you that the Helm chart has been installed.
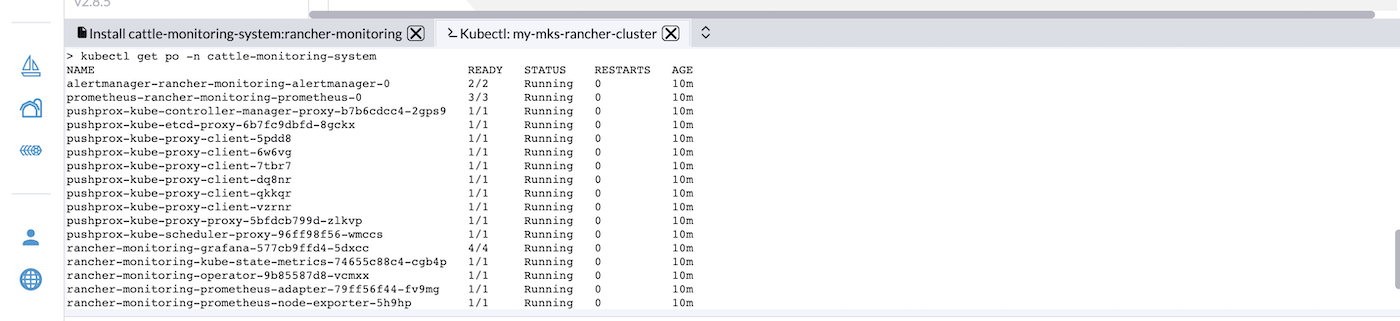
Click the Kubectl Shell icon to open a terminal inside Rancher and then execute the following command to list the monitoring pods installed:
View metrics and Grafana dashboards
By default, the monitoring application deploys:
- Grafana dashboards (curated by the kube-prometheus project) onto a cluster.
- An Alertmanager UI and a Prometheus UI.
- Exporters (such as node-exporter and kube-state-metrics).
- Some alerts by default.
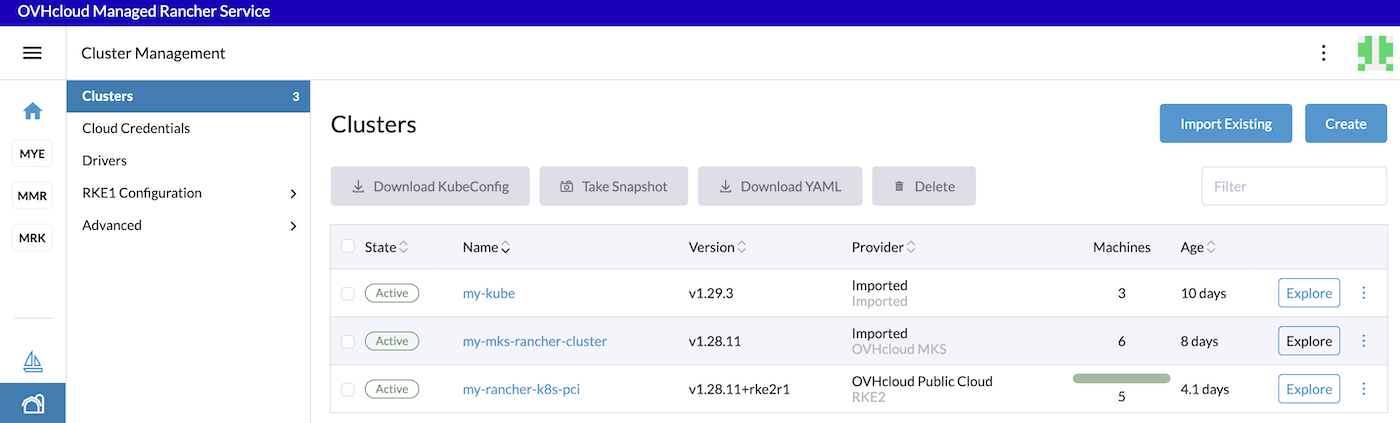
On the Rancher UI, click the Cluster Management menu, then click the Explore button for the cluster which metrics you want to visualize.
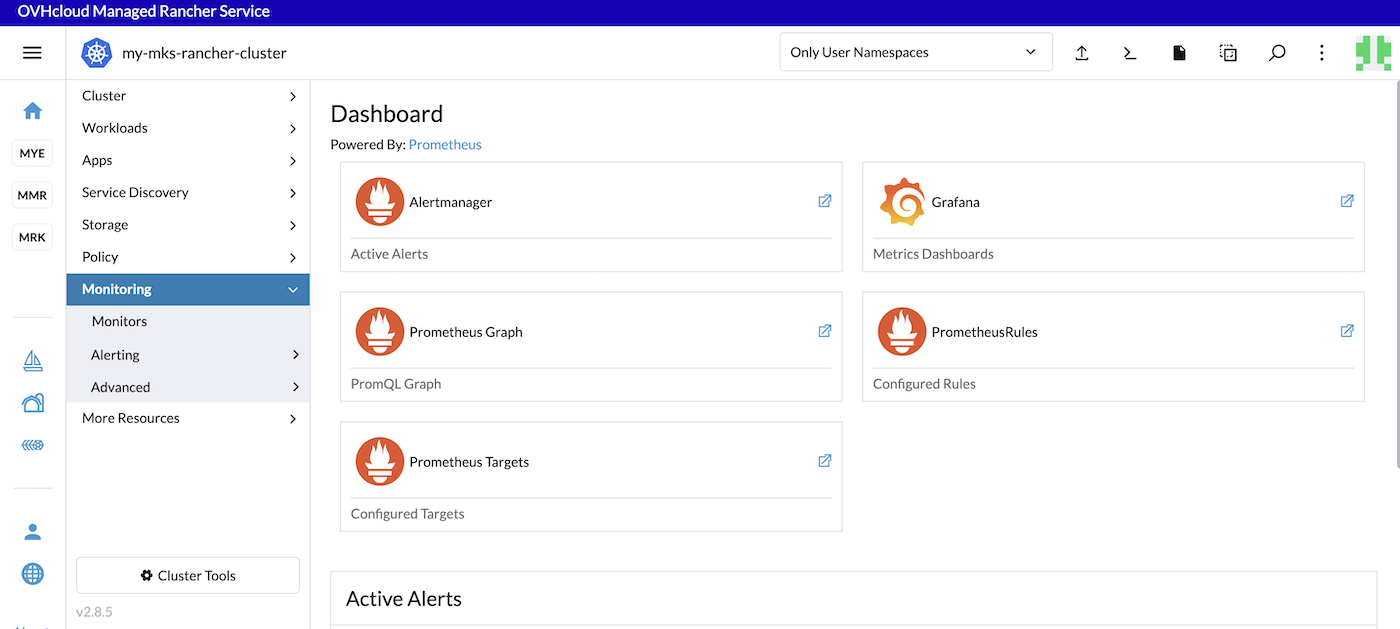
In the left navigation bar, click on Monitoring.
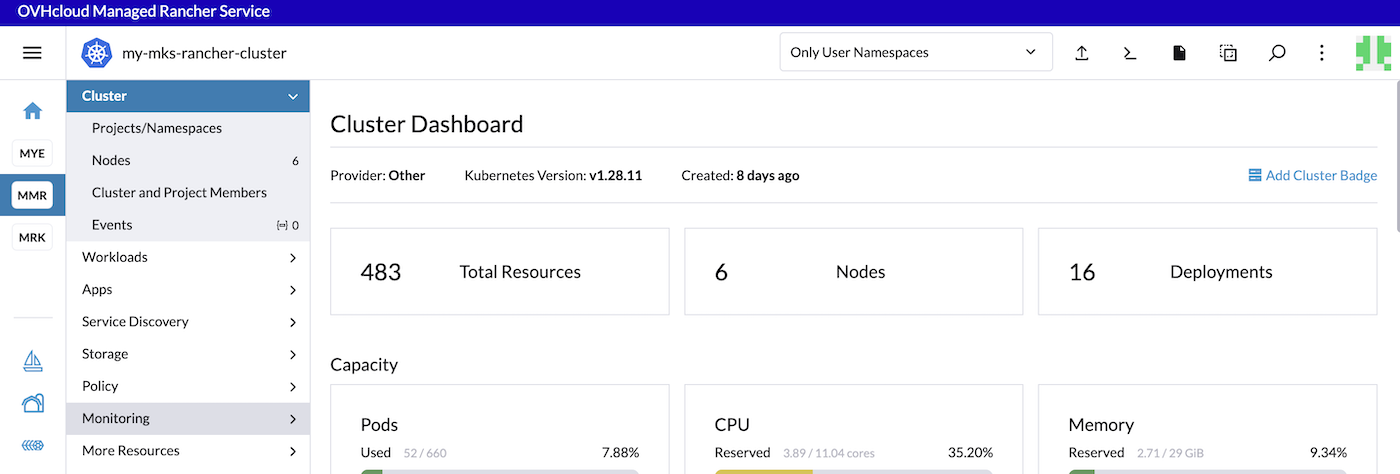
In this page you can see the links to the Alertmanager, Grafana dashboard and also active Prometheus alerts.
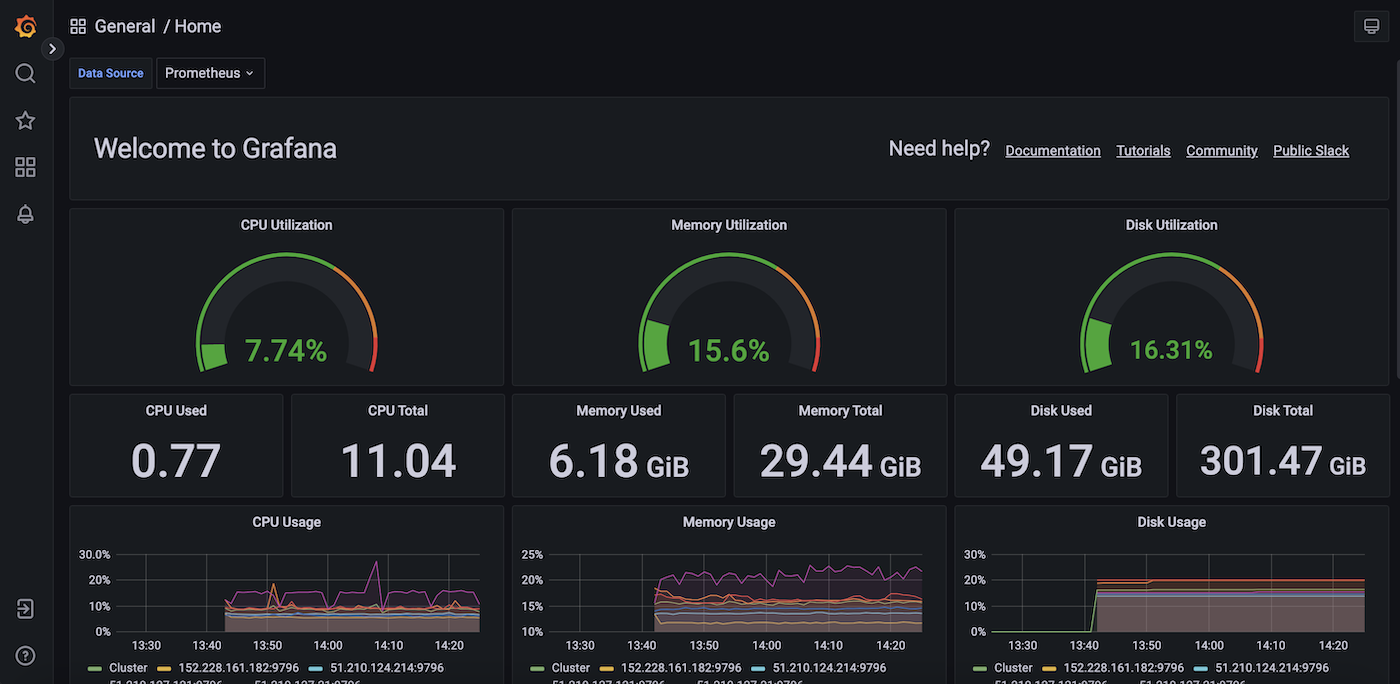
By clicking on the Grafana link you can see the Grafana dashboards:
You can also execute PromQL queries.
Without doing anything on your side, several built-in metrics are already available. You can test them by typing sum(kube_pod_owner{job="kube-state-metrics"}) by (namespace) in the search bar.
Click the Execute button to determine if the Kubernetes metrics are visible:
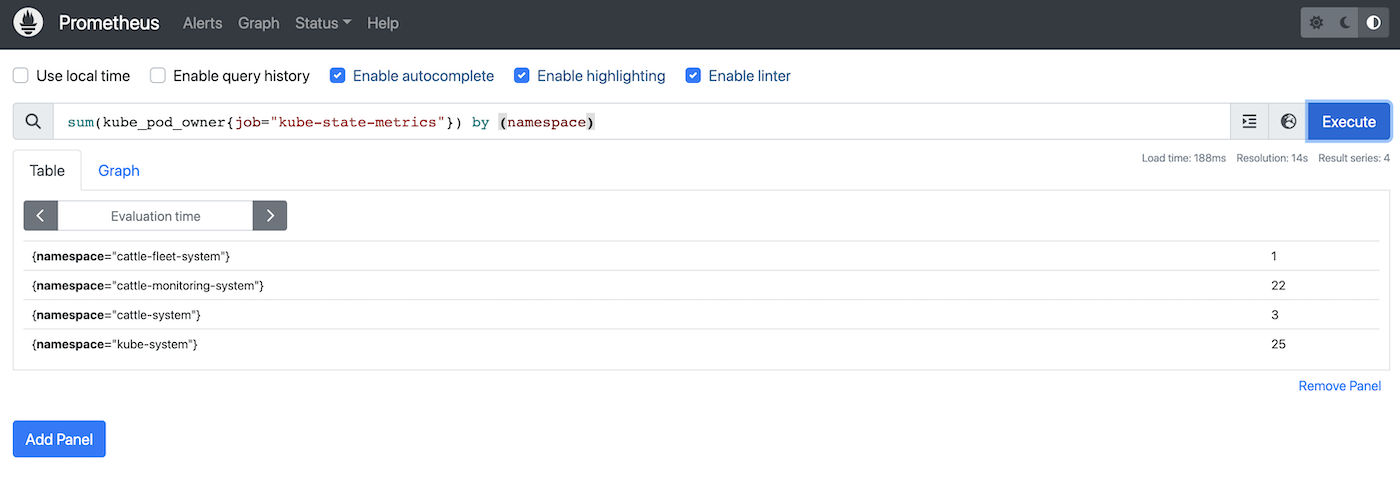
Thanks to this PromQL query you can list the number of pods per namespace in your Kubernetes cluster.
Known issues
In the installation view, you can have a warning message: "This chart requires 4.5 CPU cores, but the cluster only has xx.x available":
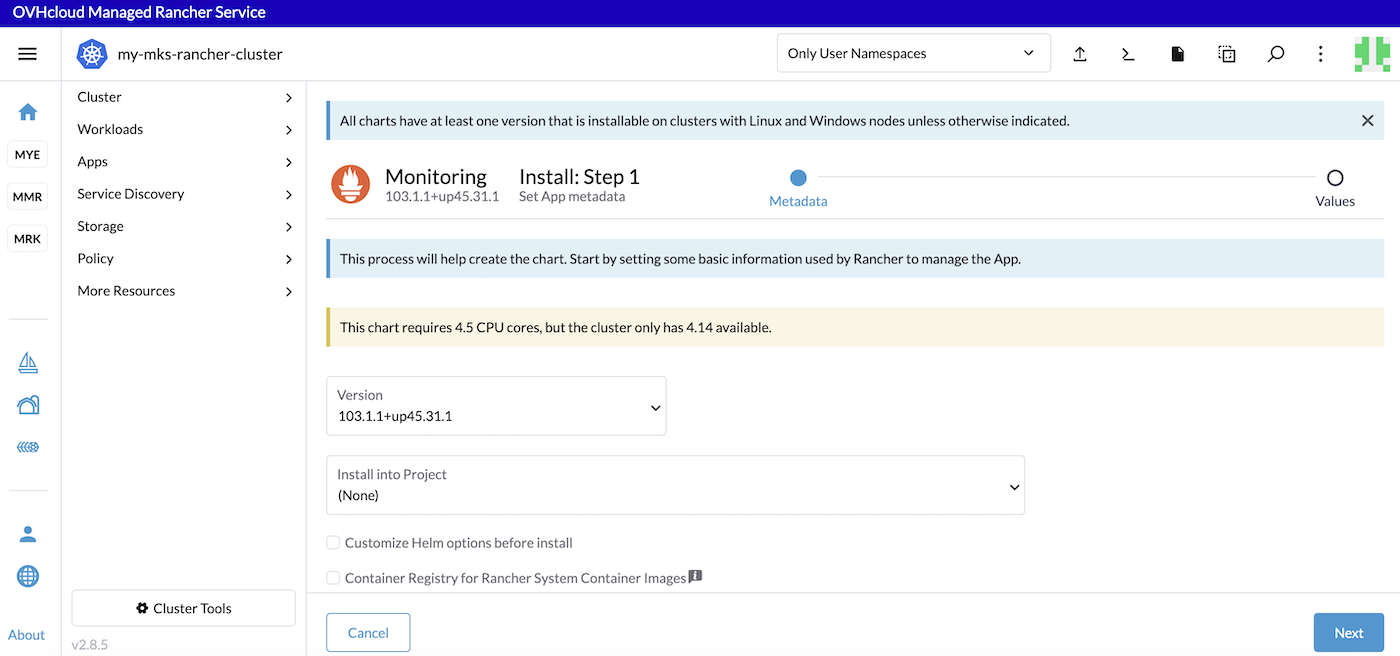
If it's the case, you can add more nodes in your Kubernetes cluster and try the installation of the monitoring stack.
Go further
-
Follow the Rancher official documentation to know more about monitoring and alerting.
-
When the monitoring application is installed, you will be able to edit components in the Rancher UI.
-
To have an overview of OVHcloud Managed Rancher Service, you can go to the OVHcloud Managed Rancher Service page.
-
If you need training or technical assistance to implement our solutions, contact your sales representative or click on this link to get a quote and ask our Professional Services experts for assisting you on your specific use case of your project.
-
Our team remains available on our dedicated Discord Channel, do not hesitate to join and reach us : https://discord.gg/ovhcloud. Ask questions, provide feedback and interact directly with the team that builds our Container and Orchestration services.
-
Join our community of users.

