OPCP - How to see the node inventory
29 Views
Objective
This guide explains how to view the hardware inventory, consumed resources, and available resources on an OVHcloud On-Prem Cloud Platform (OPCP) using:
- Grafana: real-time infrastructure monitoring
- NetBox: physical and logical inventory
- OpenStack Horizon: Ironic inventory via Horizon
- OpenStack CLI: Ironic inventory via CLI
In OpenStack, a node corresponds to a physical server in the OPCP rack.
In this guide, the term node is therefore used to refer to a physical server.
Prerequisites
- Being an administrator of the OPCP infrastructure and have access to the administration interface
admin.dashboard. - OpenStack CLI configured with the required permissions (
clouds.yamlor environment variables).
Instructions
1. Inventory and monitoring via Grafana
Grafana provides a real-time monitoring view and allows you to easily track changes in your OPCP infrastructure.
1.1 Access the Home dashboard
- Log in to the administration URL
admin.dashboard. - Click Grafana.
- Click Dashboards and search for the OpenStack overview dashboard.
You should see a dashboard similar to the following image:
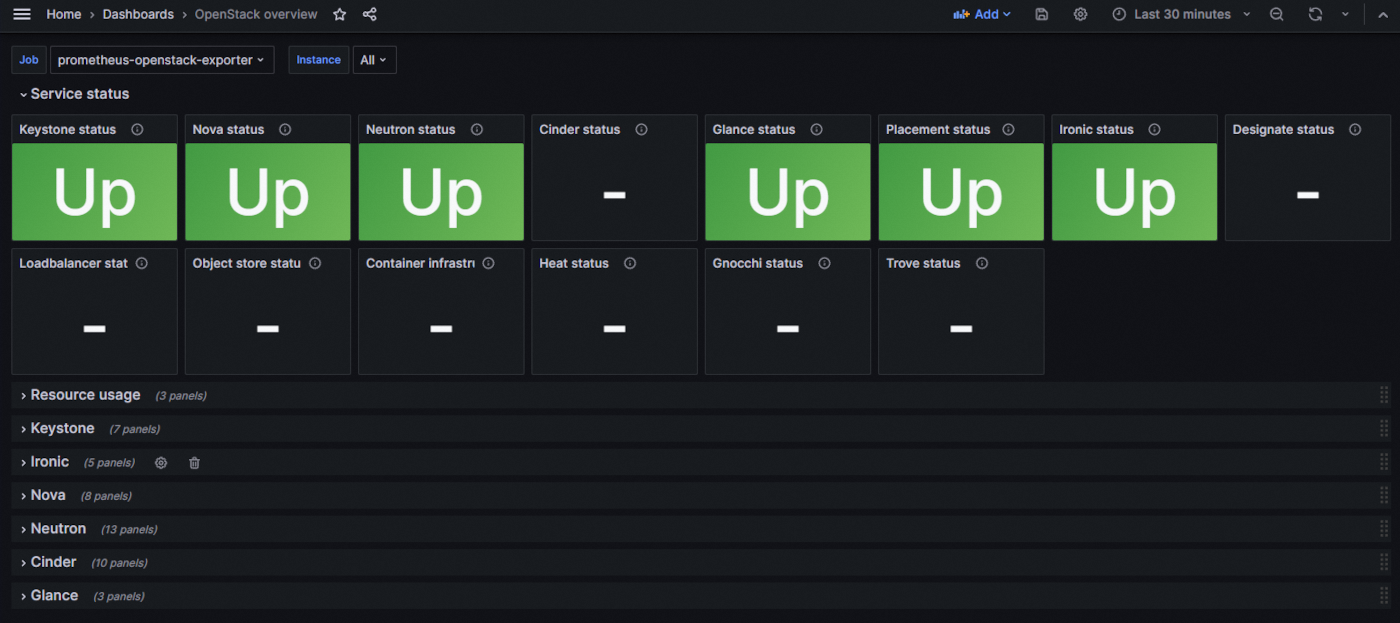
1.2 Understanding the OpenStack overview dashboard
The dashboard allows you to visualize:
- OpenStack service status: Service status
- Resource usage: Resource usage
- A detailed view of the Keystone service: Keystone
- A detailed view of the Ironic service: Ironic
- A detailed view of the Nova service: Nova
- A detailed view of the Neutron service: Neutron
- A detailed view of the Cinder service: Cinder
- A detailed view of the Glance service: Glance
1.3 Understanding and using the Ironic section
We will focus on the "Ironic" section, as this is where you can see the status of the different nodes.
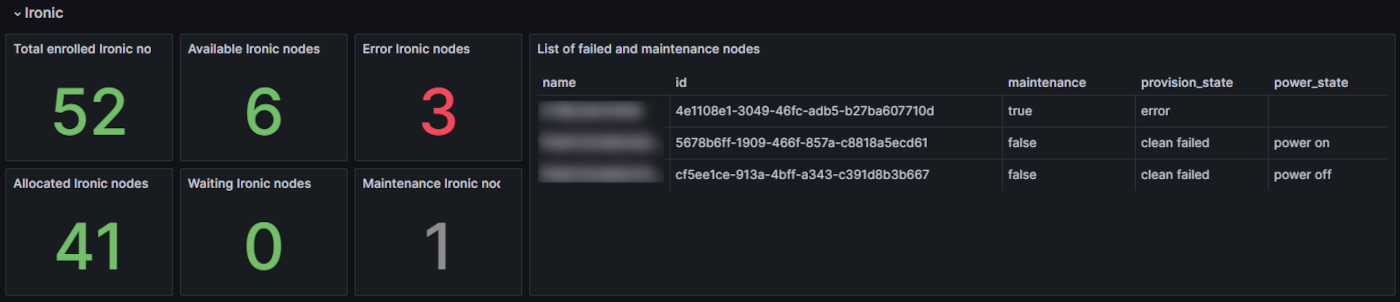
This section allows you to view:
- Total number of nodes: Total enrolled Ironic nodes
- Number of available nodes not in maintenance: Available Ironic nodes
- Number of nodes in error: Error Ironic nodes
- List of nodes in error or maintenance: List of failed and maintenance nodes
- Number of allocated nodes: Allocated Ironic nodes
- Number of waiting nodes: Waiting Ironic nodes
- Number of nodes in maintenance: Maintenance Ironic nodes
2. Hardware and logical inventory with NetBox
NetBox is the reference tool for managing the physical, network, and logical inventory of your infrastructure.
The NetBox inventory is automatically populated; no manual action is required to add or modify nodes.
2.1 Access NetBox
- Log in to the administration URL
admin.dashboard. - Click NetBox.
2.2 View the node inventory
In Devices, you can see the complete list of equipment in your OPCP rack (nodes, network equipment, etc.).
You can:
- use the quick search to find an item by name;
- use Filters for advanced searches.
For example, you can list all non-production nodes by applying the following filters:
- Status: Decommissioned, Inventory, Failed, Planned
- Role: server
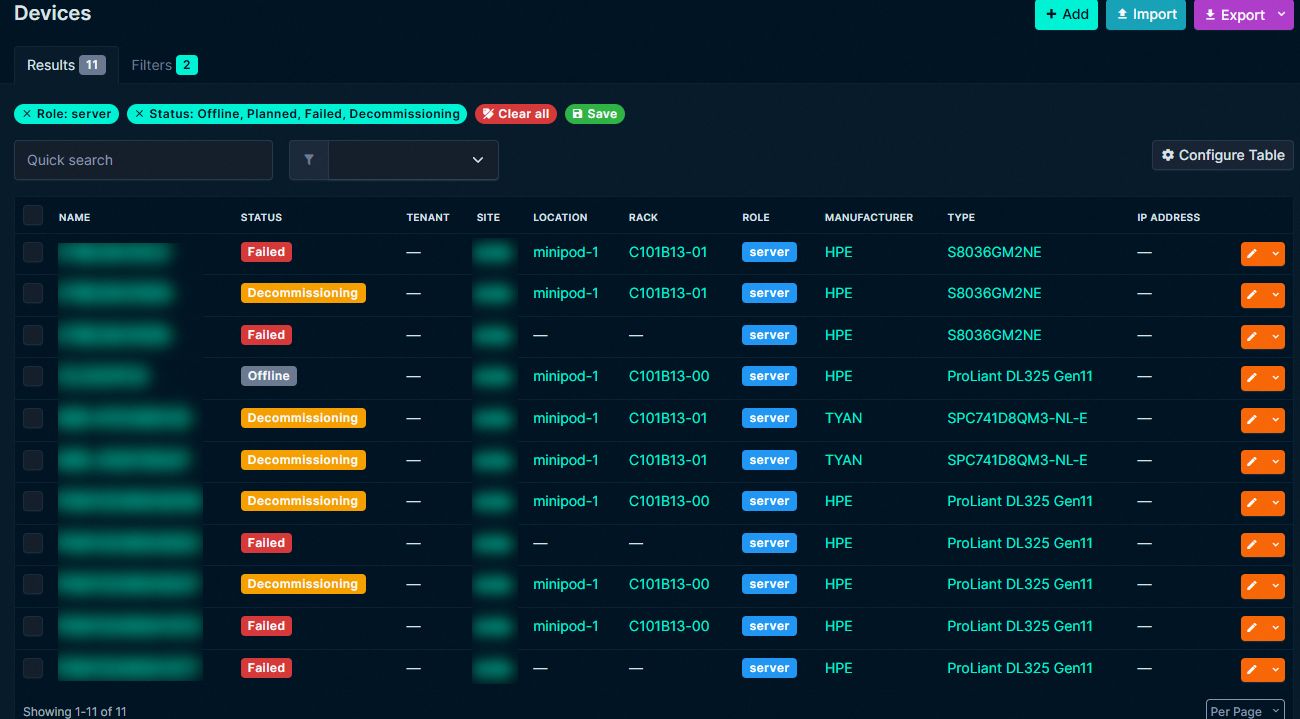
You can save the search to reuse it later.
3. OpenStack Horizon – Ironic UI
3.1 Access the Ironic interface
- Log in to the administration URL
admin.dashboard - Click Horizon
- Click Admin
- Click System, then Ironic Bare Metal Provisioning
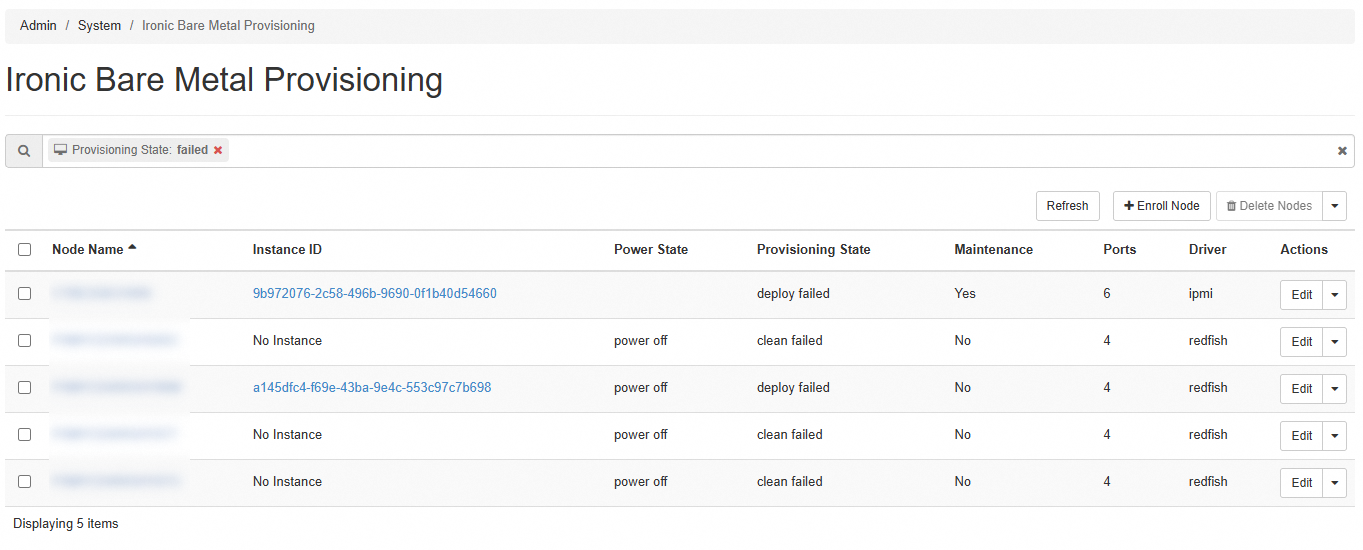
3.2 List all nodes
In Ironic Bare Metal Provisioning, you can see all nodes.
You can filter nodes by their status, for example: Provisioning State = failed.
4. Resource status via OpenStack CLI
The OpenStack CLI allows you to obtain the real-time status of allocated and available resources.
4.1 List all nodes
Example output:
4.2 Filter nodes
You can filter results using --provision-state to view nodes in a specific state, or --maintenance to view nodes in maintenance.
All available filters can be found using --help.
Example output:
4.3 Node details
To retrieve all information about a node, for example to identify the last error and understand why the deployment failed:
Go further
If you need training or technical assistance for the implementation of our solutions, contact your sales representative or click this link to request a quote and have your project analyzed by our Professional Services team experts.
Join our community of users.

