Checking a slow machine
528 Views
Objective
Use the vSphere monitoring tools to troubleshoot a slow VM.
This guide offers a step by step study case to troubleshoot performance issues on a VM.
Requirements
- Being an administrative contact of your Hosted Private Cloud infrastructure to receive login credentials
- A user account with access to vSphere (created in the OVHcloud Control Panel)
Instructions
You have three levels of monitoring accessible in vSphere to troubleshoot issues:
- VM
- Cluster
- Storage
VM Monitoring
In the vSphere interface menu, go to the Hosts and Clusters dashboard.
Navigate to your VM and select it.
The Monitor tab presents performance Overview.
You may see real-time metrics or choose to check a timeframe to see performance evolution.
You may also change the view to dig on more specific subjects.
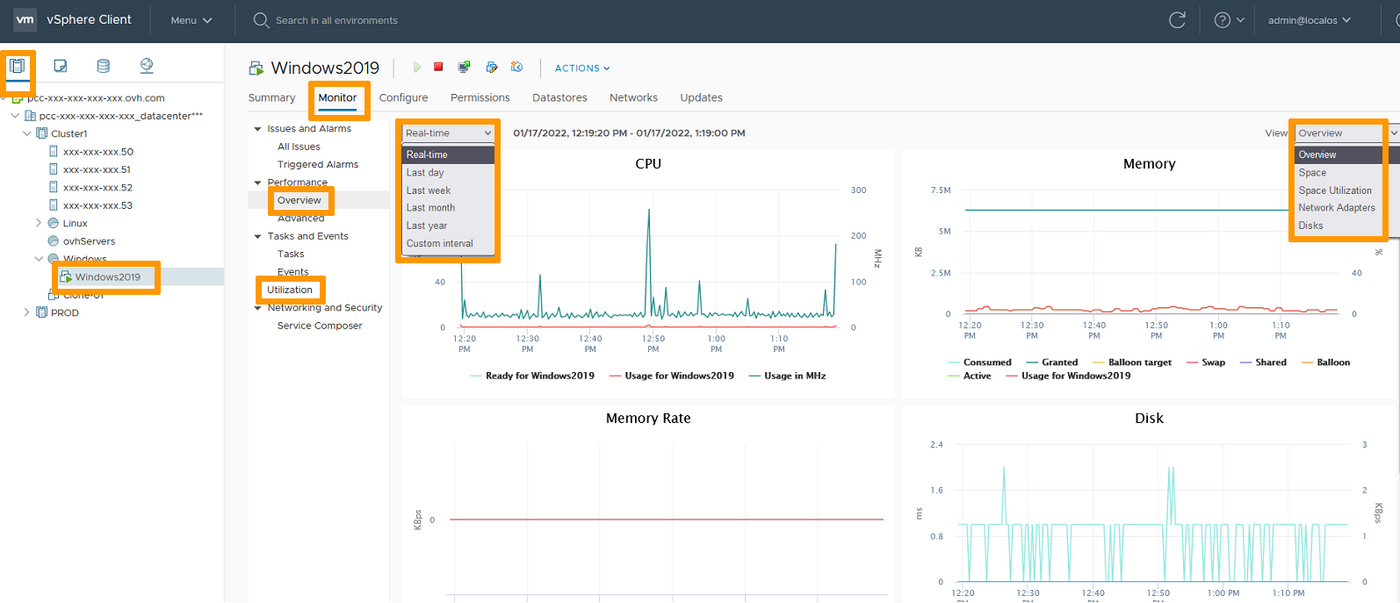
You may also use the Utilization section to help your investigations.
Cluster monitoring
In the vSphere interface menu, go to the Hosts and Clusters dashboard.
Navigate to your Cluster and select it.
The Monitor tab presents performance Overview.
You may see real-time metrics or choose to check a timeframe to see performance evolution.
You may also change the view to dig on more specific subjects.
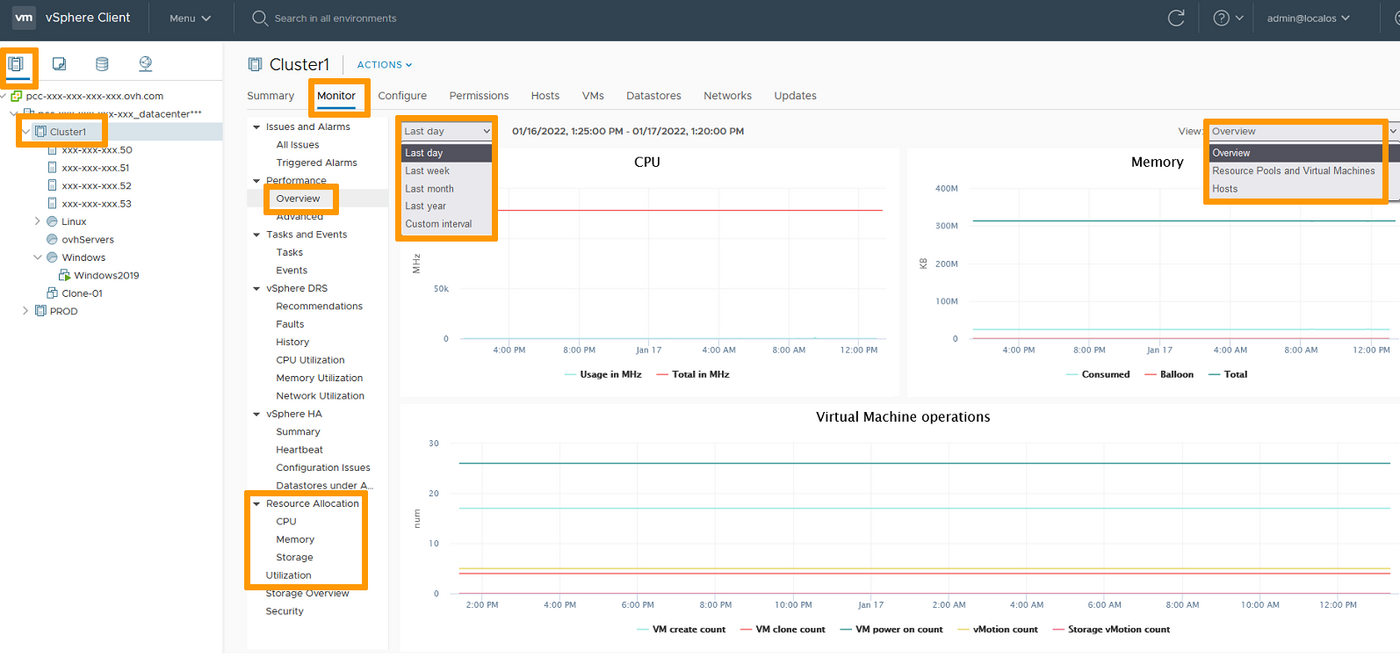
You may also use the Resource Allocation and Utilization sections to help your investigations.
Resource Pools can be accessed and monitored in the same way clusters are.
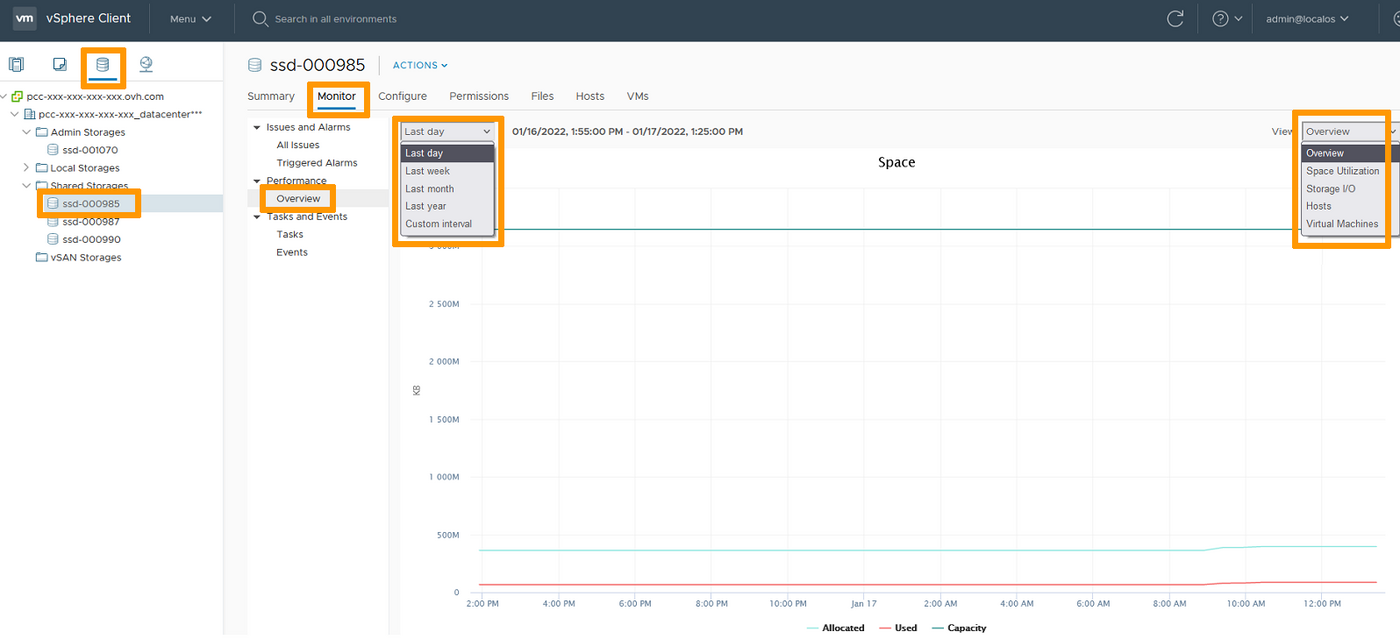
Storage monitoring
In the vSphere interface menu, go to the Storage dashboard.
Navigate to your datastore and select it.
The Monitor tab presents performance Overview.
You may see real-time metrics or choose to check a timeframe to see performance evolution.
You may also change the view to dig on more specific subjects.
Go further
Join our community of users on https://community.ovh.com/en/.

