Monitoring apps with Prometheus and Grafana on an OVHcloud Managed Kubernetes Service
598 Views
Objective
In this tutorial we will show you how to monitor your applications/workloads on an OVHcloud Managed Kubernetes cluster.
Before you begin
This tutorial presupposes that you already have a working OVHcloud Managed Kubernetes cluster, and some basic knowledge of how to operate it. If you want to know more on those topics, please look at the OVHcloud Managed Kubernetes Service Quickstart guide.
You also need to have Helm installed on your workstation and your cluster. Please refer to the How to install Helm on OVHcloud Managed Kubernetes Service tutorial.
Instructions
In this guide you will:
- install Prometheus operator (it will install Prometheus & Grafana)
- query Prometheus
- visualize metrics on Grafana
Prometheus operator
The Prometheus Operator provides Kubernetes native deployment and management of Prometheus and related monitoring components.
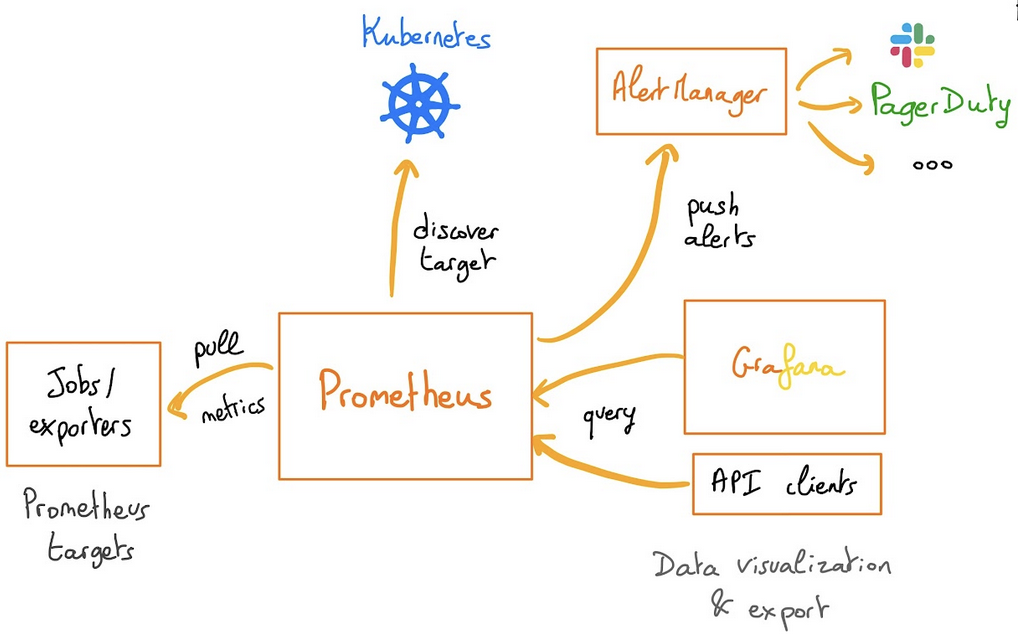
The purpose of this project is to simplify and automate the configuration of a Prometheus-based monitoring stack for Kubernetes clusters. The Prometheus operator also deploys Grafana and its dashboards, to visualize our metrics in a user-friendly way.
If you are interested in the operator, feel free to read the Prometheus operator official documentation.
Installing the Prometheus operator
For this tutorial we are using the Prometheus Operator Helm chart found on the Prometheus Community repository.
Add the Prometheus Helm repository:
This will add the Prometheus repository and update all of your repositories:
To install the Prometheus Operator Helm chart in your OVHcloud Managed Kubernetes cluster, you need to customize some values.
To do this, you can set parameters on the command line (--set param.name=value) or create a local file based on the values from the chart and pass it on the command line (--values /tmp/kube-prometheus-stack.values).
For this tutorial we choose the first method.
To install Prometheus and Grafana:
You can install only Prometheus without Grafana by setting the following property to false: --set grafana.enabled=false
As you can see, a new prometheus namespace will be created and we specified that we want to deploy a LoadBalancer in order to access externally to Prometheus and Grafana easily.
You should have a behavior like this:
You can also verify by checking the Pods in the new prometheus namespace:
You can also check that Prometheus and Grafana have an external IP:
If it's not the case, please wait until the Load Balancers are correctly created.
Visualize the metrics
Now you can retrieve Prometheus and Grafana URLs with the following commands:
You should obtain the following result:
Open your browser and go to the Prometheus interface.
Without doing anything on your side, several built-in metrics are already available. You can test them by typing sum(kube_pod_owner{job="kube-state-metrics"}) by (namespace) in the search bar.
Click on the Execute button to determine if the Kubernetes metrics are visible:
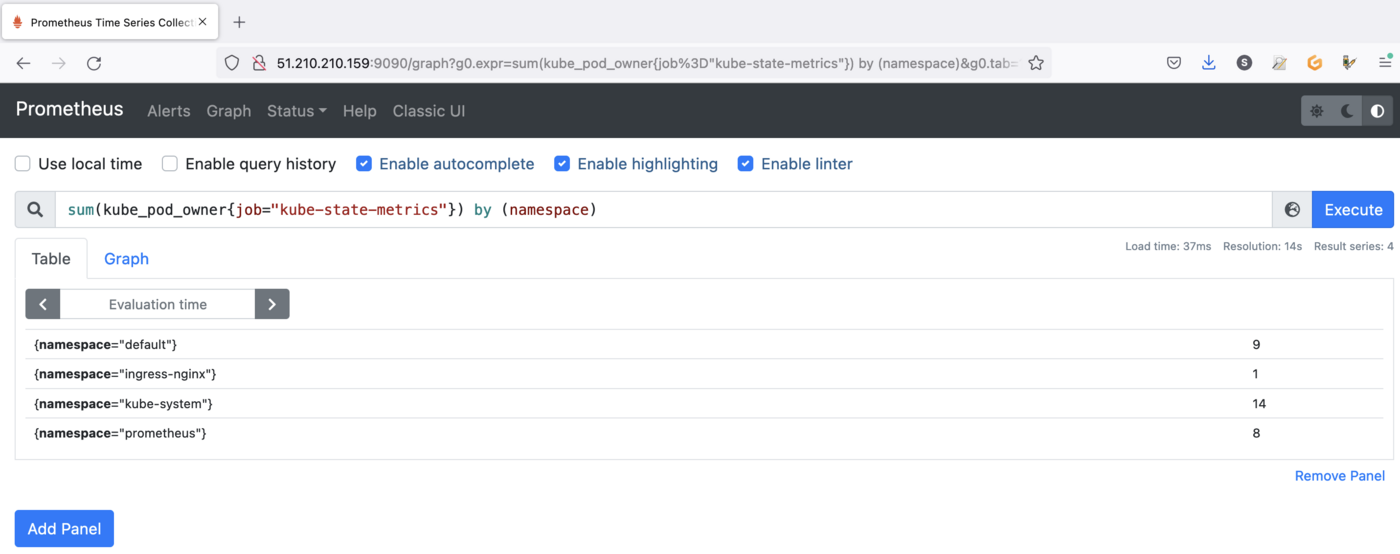
Thanks to the PromQL query you can list the number of pods per namespace in your Kubernetes cluster.
Kubernetes components emit metrics in Prometheus format. You can find more information in the Kubernetes official documentation.
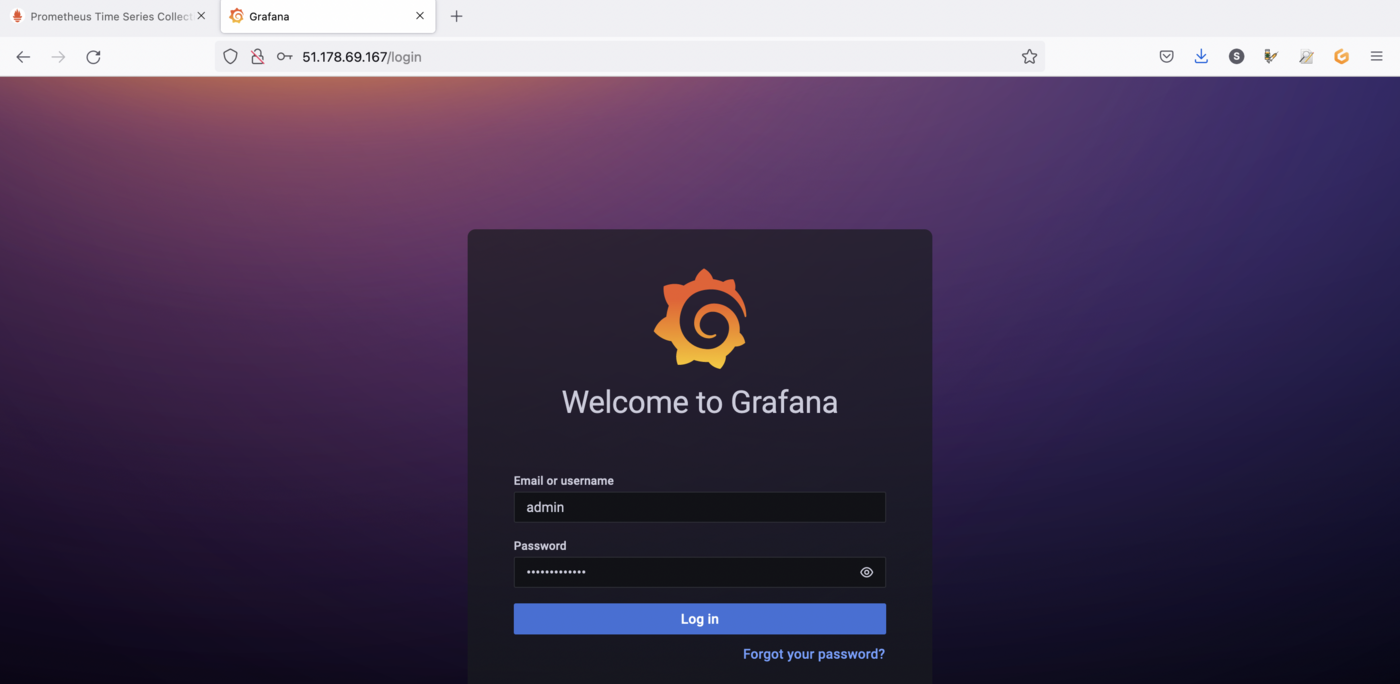
You can also go to the Grafana interface. Open your browser and point to http://$GRAFANA_URL value using the credentials below:
- Login:
admin - Password:
prom-operator(by default)
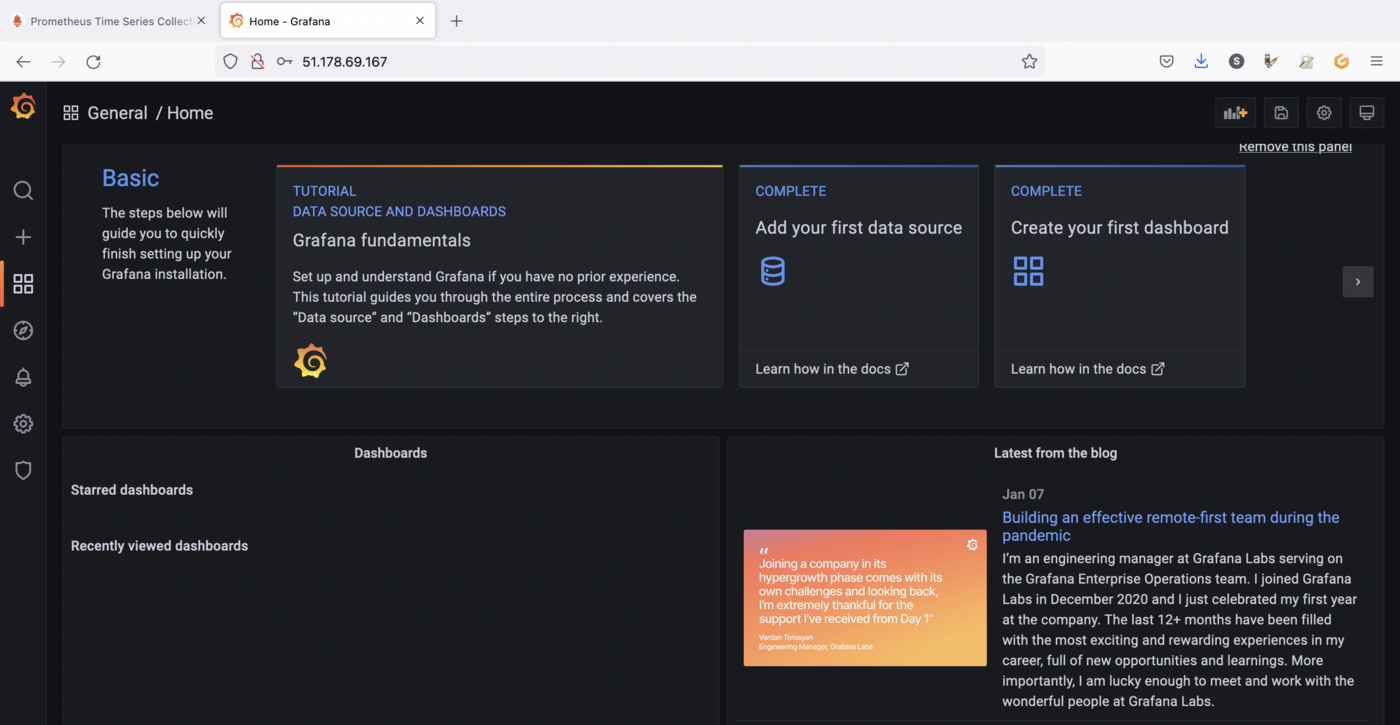
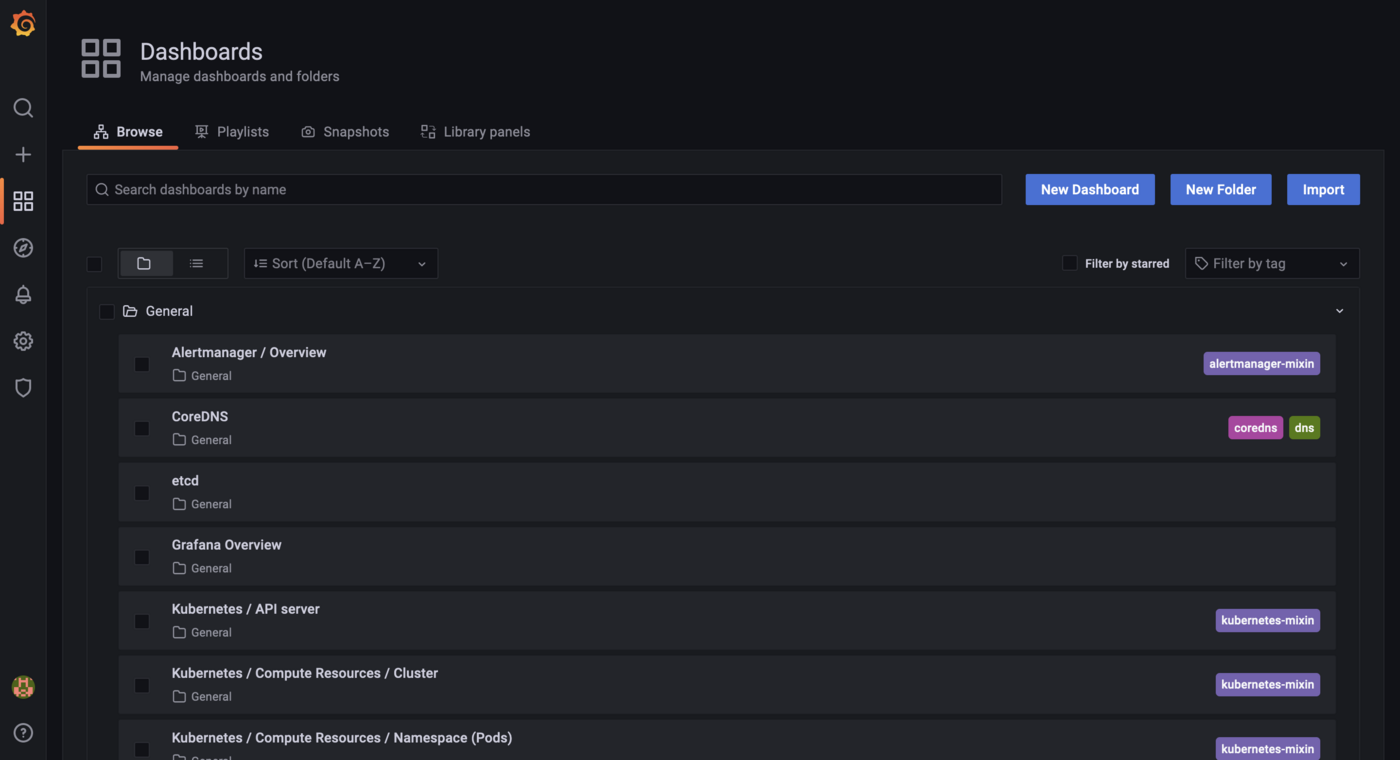
This time again, thanks to the prometheus operator and without doing anything on your side, several dashboards are available. You can display them by clicking on the Dashboards icon, in the Grafana sidebar, then on browse:

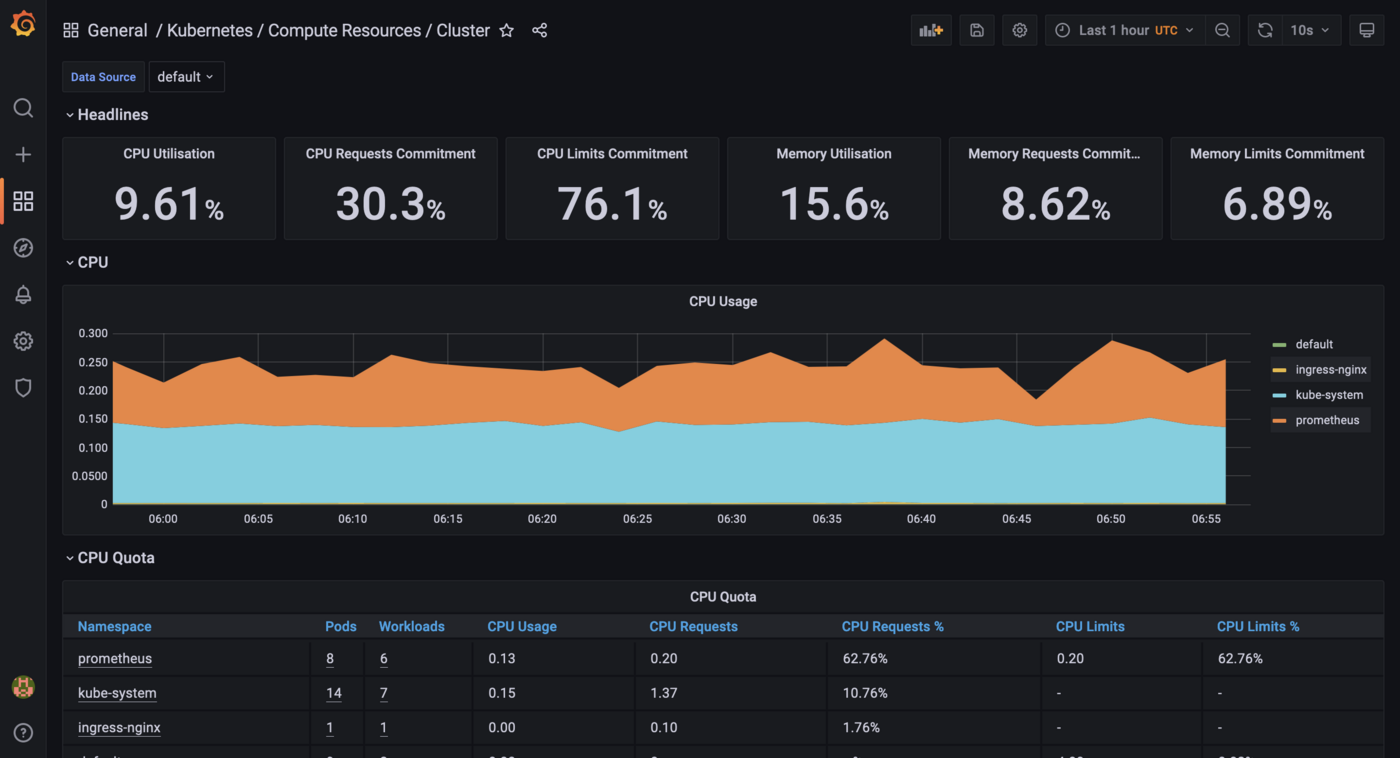
For example, you can click on the General/Kubernetes/Compute Resources/Cluster dashboard to visualize the metrics of your Kubernetes cluster:
Cleanup
First, execute the helm list command in every namespace (with -A option) in your Kubernetes cluster to see what you've installed.
Now, you can delete what you've installed in this tutorial, thanks to helm uninstall commands:
You should have a behavior like this:
Go further
Prometheus and Grafana are very powerful monitoring tools, but also have alerting systems. Don't hesitate to dig in, to create alerts for example.
To learn more about using your Kubernetes cluster the practical way, we invite you to look at our OVHcloud Managed Kubernetes documentation.
-
If you need training or technical assistance to implement our solutions, contact your sales representative or click on this link to get a quote and ask our Professional Services experts for assisting you on your specific use case of your project.
-
Join our community of users.

