Distributed tracing with Jaeger on an OVHcloud Managed Kubernetes Service
312 Ansichten
Objective
Jaeger is an open-source distributed tracing platform.
![]()
It can be used for monitoring microservices-based distributed systems:
- Distributed context propagation
- Distributed transaction monitoring
- Root cause analysis
- Service dependency analysis
- Performance / latency optimization
Jaeger contains several components:
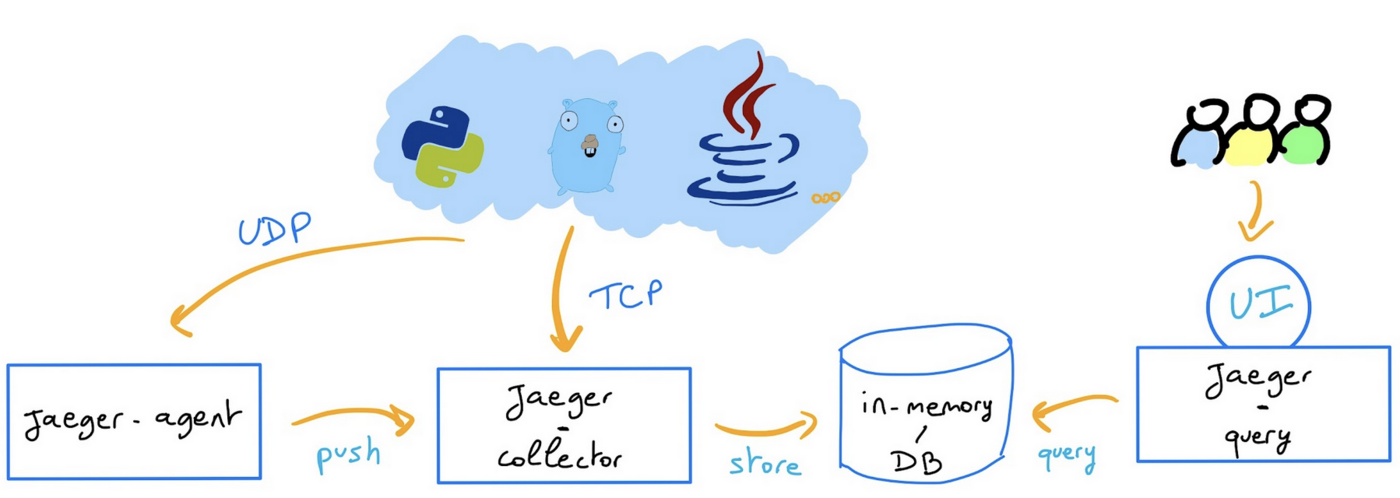
Read more about Jaeger architecture and components.
In this guide you will:
- Install Jaeger Operator
- Deploy Jaeger components
- Access to the UI
- Deploy your instrumented application
- Visualize traces
You can use the Reset cluster function in the Public Cloud section of the OVHcloud Control Panel to reinitialize your cluster before following this tutorial.
Requirements
This tutorial presupposes that you already have a working OVHcloud Managed Kubernetes cluster, and some basic knowledge of how to operate it. If you want to know more on those topics, please look at the OVHcloud Managed Kubernetes Service Quickstart.
You also need to have Helm installed on your workstation and your cluster. Please refer to the How to install Helm on OVHcloud Managed Kubernetes Service tutorial.
Instructions
In this guide we will show you how to deploy Jaeger as distributed tracing platform backend and then how to deploy your instrumented application that will send their traces to Jaeger.
Installing Jaeger
For this tutorial we are using the Jaeger Helm chart.
Add the Jaeger Helm repository:
These commands will add the Jaeger Helm repository to your local Helm chart repository and update the installed chart repositories:
The Jaeger repository provides two charts: jaeger and jaeger-operator. For the guide, you will deploy the jaeger-operator chart, which makes it easy to configure a minimal installation.
To learn more about the Jaeger Operator for Kubernetes, consult the official documentation.
Install the latest version of Jaeger with helm install command:
This command will install the latest version of Jaeger operator and observability namespace:
Thanks to the variable overriding rbac.clusterRole=true, you ask the operator to watch all namespaces.
Check the Jaeger Operator is running:
The simplest possible way to create a Jaeger instance is by creating a YAML file that will install the default AllInOne image. This “all-in-one” image includes: agent, collector, query, ingester and Jaeger UI in a single pod, using in-memory storage by default.
For this guide you will deploy Jaeger components through this simple way, which can be used for development, testing and demo purposes but for production strategy you can read the official documentation.
Once the jaeger-operator pod in the namespace observability is ready, create a jaeger.yaml file with the following content:
In this YAML manifest file we specify that you want to access the Jaeger UI (jaeger-query) through a Load Balancer.
And apply it:
These commands will create a new CRD Jaeger and an instance named jaeger:
You can now check if the Jaeger instance is running with the following commands:
Theses commands will check if the instances were created, list the Jaeger objects and list the pods that are running:
You can also check that all Jaeger services have been correctly deployed:
Access to Jaeger UI
Now you can retrieve Jaeger UI URL with the following command:
You should obtain the following result:
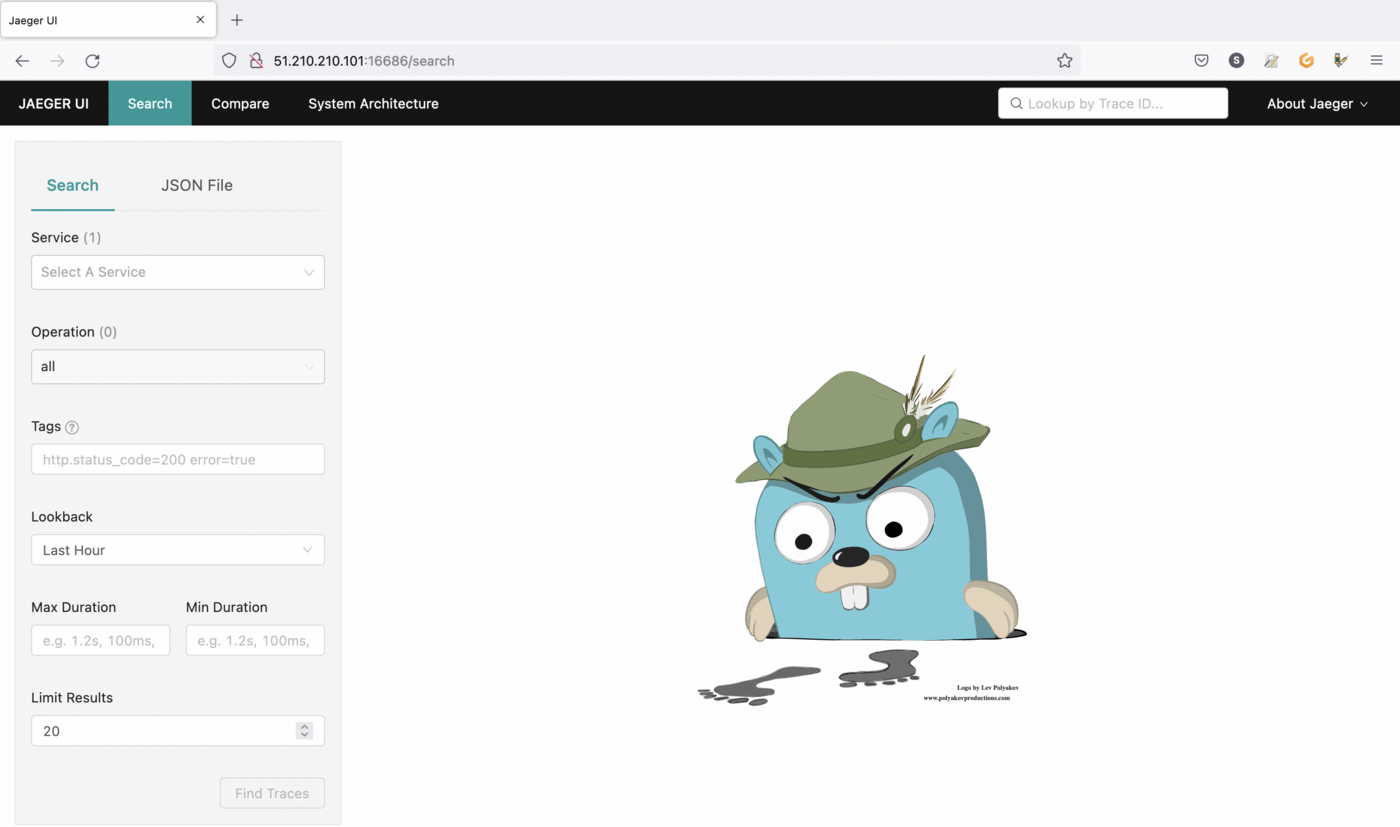
Open your browser and go to the Jaeger interface.
Deploy your instrumented application
In order to link your application to the Jaeger backend you need to use a tool like OpenTelemetry.
![]()
OpenTelemetry is a collection of tools, APIs, and SDKs. Useful to instrument, generate, collect, and export telemetry data (metrics, logs, and traces) to help you analyze your software’s performance and behavior.
OpenTelemetry integrates with popular libraries and frameworks such as Spring, Express, Quarkus, and with a lot of languages. Go to the documentation to see how to integrate your application.
For this guide you will deploy a Golang application, instrumented with OpenTelemetry, that will send traces to a provider: your Jaeger collector.
Our main.go file contains:
- the import of the OpenTelemetry dependencies,
- a
tracerProvidermethod that initiates a connection to a Jaeger provider - a
main()method that connects to the Jaeger collector you previously deployed and creates and sends a span each time the/HTTP route will be called
The code source of the application is available on GitHub.
We already packaged a Golang application into a Docker image and pushed it in our ovhplatform Docker Hub repository so you can use it directly.
In order to deploy the application on your OVHcloud managed Kubernetes Service, create a deployment.yaml file with the following content:
This YAML deployment manifest file defines that our application, based on ovhplatform/what-is-my-pod-with-tracing:1.0.2 image will be deployed with 3 replicas (3 pods). We pass the pod name on environment variable in order to display it in our what-is-my-pod-with-tracing application.
Then, create a svc.yaml file with the following content to define our service (a service exposes a deployment):
Apply the deployment and service manifest files to your cluster with the following commands:
Output should be like this:
You can verify if your application is running and service is created by running the following commands:
Output should be like this:
In order to generate traffic you need to get the external IP of your service:
And then generate traffic with curl command:
You should obtain the following result:
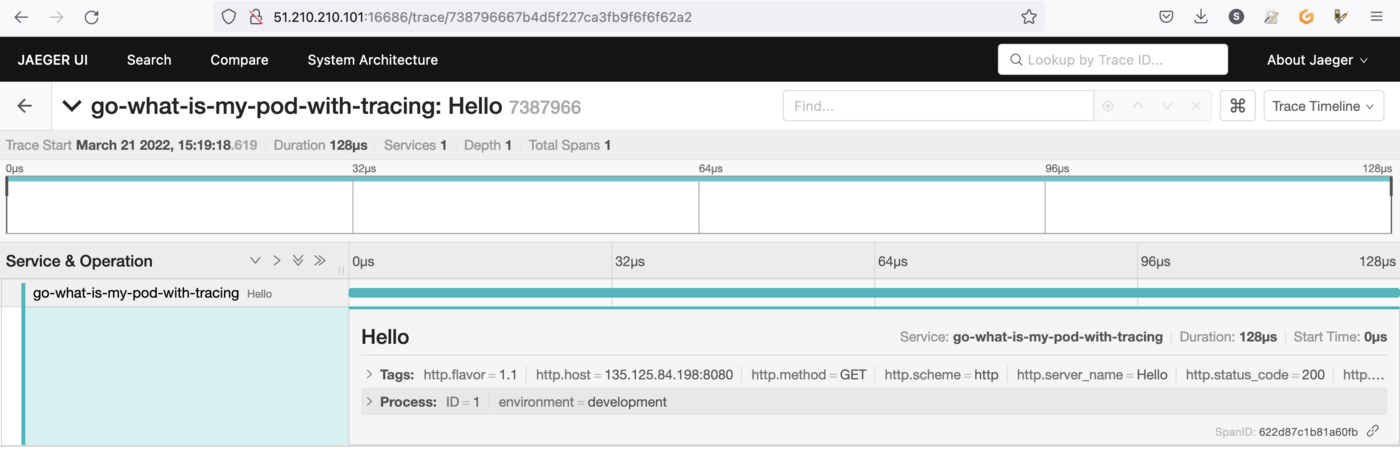
Visualize traces
Open your browser and go back to the Jaeger interface (http://$JAEGER_URL:16686).
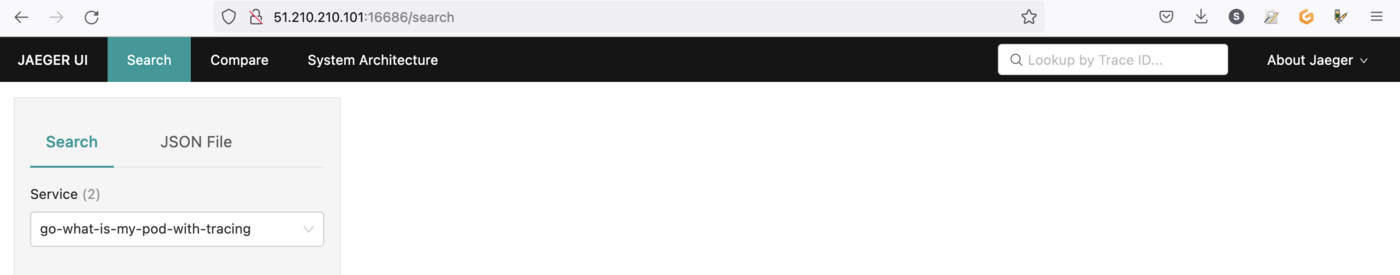
You should now see two available services:
- go-what-is-my-pod-with-tracing
- jaeger-query
Select go-what-is-my-pod-with-tracing service and click on Find Traces button.
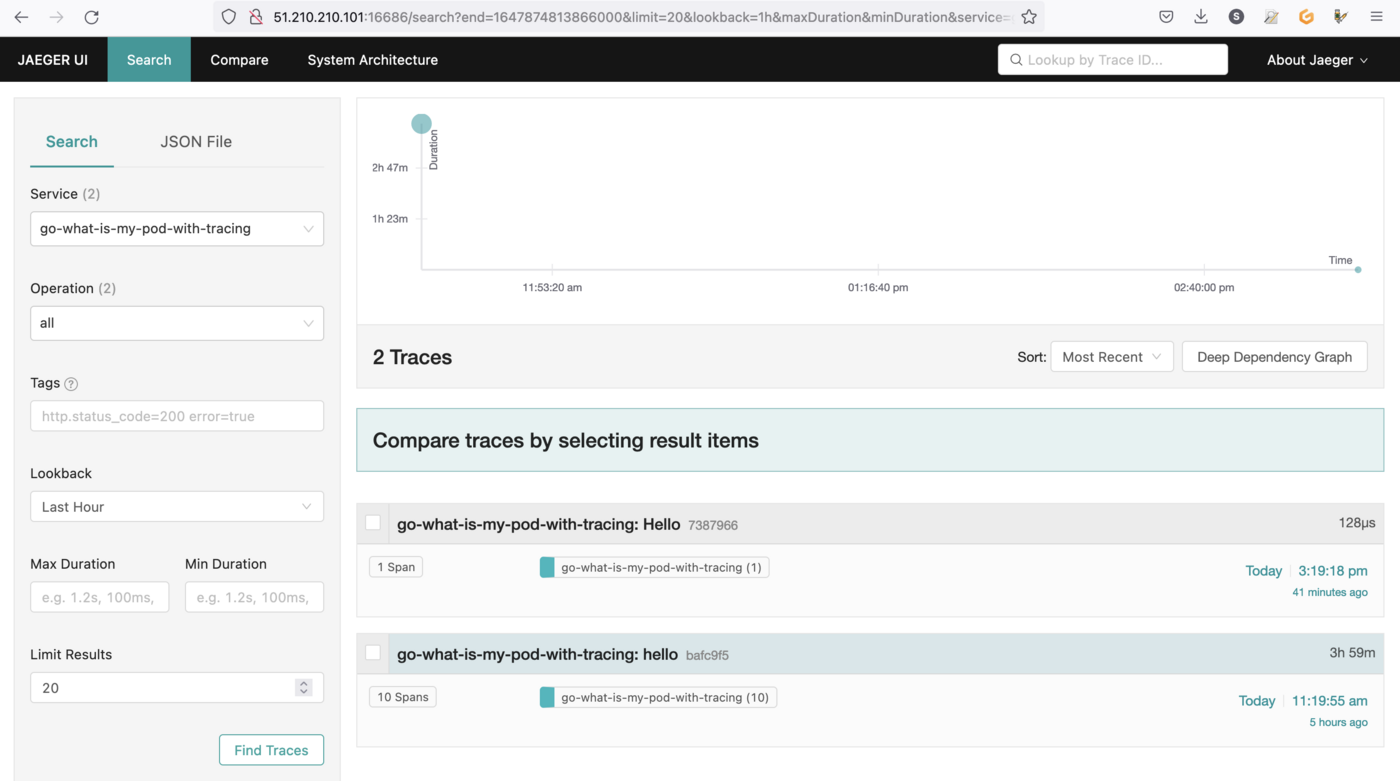
You can now click in a trace and visualize useful information.
Cleanup
Delete Jaeger components (created by the operator):
Wait until the components are deleted and then you can uninstall the operator.
To uninstall Jaeger Operator, as you installed it through Helm, you can use helm uninstall command in order to delete the Jaeger Helm installed chart:
Delete the observability namespace:
And delete the deployed application:
Go further
-
If you need training or technical assistance to implement our solutions, contact your sales representative or click on this link to get a quote and ask our Professional Services experts for assisting you on your specific use case of your project.
-
Join our community of users on https://community.ovh.com/en/.

