Monitoring GPU usage on OVHcloud Managed Kubernetes Service
305 Ansichten
Objective
In this tutorial we will show you how to monitor a GPU application on an OVHcloud Managed Kubernetes cluster.

GPUs provide compute power to drive AI/ML & Deep Learning tasks with intensive calculations such as image/object recognition, natural language processing (NLP), as well as other compute-intensive tasks such as video transcoding and image processing. Using GPUs with Kubernetes allows you to extend the scalability of Kubernetes to AI/ML applications. It is however always important to keep the costs of GPU in mind. If each application uses a dedicated GPU in model prediction scenarios, computing resources can be wasted. It is therefore important to monitor GPU usage in order to be responsive and to be able to make the right decisions and optimize usage.
Before you begin
This tutorial presupposes that you already have a working OVHcloud Managed Kubernetes cluster, and some basic knowledge of how to operate it. If you want to know more on those topics, please look at the OVHcloud Managed Kubernetes Service Quickstart.
You also need to have Helm installed on your workstation and your cluster, please refer to the How to install Helm on OVHcloud Managed Kubernetes Service tutorial.
And you also need to follow Deploying a GPU application on OVHcloud Managed Kubernetes tutorial to install NVIDIA GPU operator and configure your cluster correctly with needed components for this guide.
Instructions
In this guide you will:
- install Prometheus operator (it will install Prometheus & Grafana)
- use NVIDIA’s Data Center GPU Manager (DCGM) to expose GPU metrics for Prometheus
- deploy an application to demonstrate GPU accelerated Inference and generate traffic
- visualize metrics
DCGM & DCGM Exporter
NVIDIA Data Center GPU Manager (DCGM) is a set of tools for managing and monitoring NVIDIA GPUs in cluster environments. It's a low overhead tool suite that performs a variety of functions on each host system including active health monitoring, diagnostics, system validation, policies, power and clock management, group configuration and accounting.
To gather GPU telemetry in Kubernetes, the NVIDIA GPU Operator deploys the dcgm-exporter, based on DCGM exposes GPU metrics for Prometheus and can be visualized using Grafana.
dcgm-exporter is architected to take advantage of KubeletPodResources API and exposes GPU metrics in a format that can be scraped by Prometheus.
As you have already followed the Deploying a GPU application on OVHcloud Managed Kubernetes tutorial, you should already have dcgm-exporter running in your cluster.
Prometheus operator
The Prometheus Operator provides Kubernetes native deployment and management of Prometheus and related monitoring components.
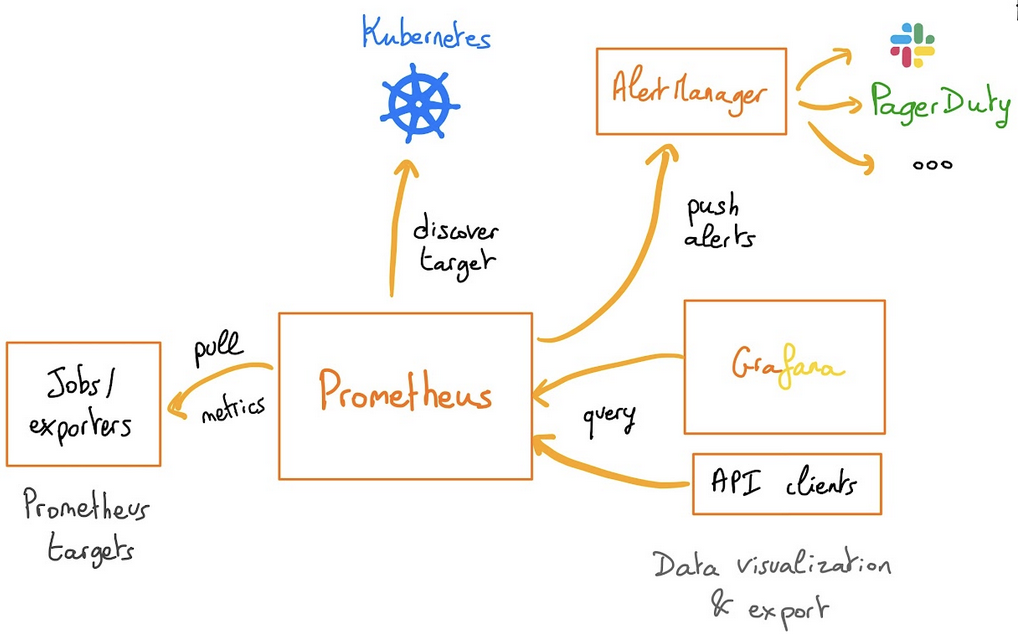
The purpose of this project is to simplify and automate the configuration of a Prometheus based monitoring stack for Kubernetes clusters. The Prometheus operator also deploys a Grafana dashboard, to visualize our metrics in a user-friendly way.
If you are interested about the operator, feel free to read the Prometheus operator official documentation.
Installing the Prometheus operator
For this tutorial we are using the Prometheus Operator Helm chart found on Prometheus Community repository.
Add the Prometheus Helm repository:
This will add the Prometheus repository and update all of your repositories:
You need to modify some settings. To do this, you will inspect the chart to retrieve these values in a file:
Open the /tmp/kube-prometheus-stack.values file in your favorite editor.
Then, into it, search for additionalScrapeConfigs (the value should be empty [] by default). You will add a ConfigMap to this section.
Before:
After:
Don't close this file before retrieving or modifying adminPassword key.
By default, Grafana password should be like this:
Please, copy the Grafana admin password, you will use it later in this tutorial.
You are now ready to install Prometheus and Grafana.
As you can see, a new prometheus namespace will be created and we specified that we want to deploy a LoadBalancer in order to access externally to Prometheus and Grafana easily.
You should have a behavior like this:
You can also verify by checking the Pods in the new prometheus namespace with the command kubectl get pods -n prometheus:
And you can check that Prometheus and Grafana have an external IP:
If it's not the case, please wait until the Load Balancers are correctly created.
Visualize the metrics
Now you can retrieve Prometheus and Grafana URL thanks to the following commands:
You should obtain the following result:
Open your browser and go to the Prometheus interface.
As you already deployed DCGM with NVIDIA GPU Operator, DCGM should already have started publishing metrics to Prometheus. The metrics availability can be verified by typing DCGM_FI_DEV_GPU_UTIL in the search bar. Click on the Execute button to determine if the GPU metrics are visible:
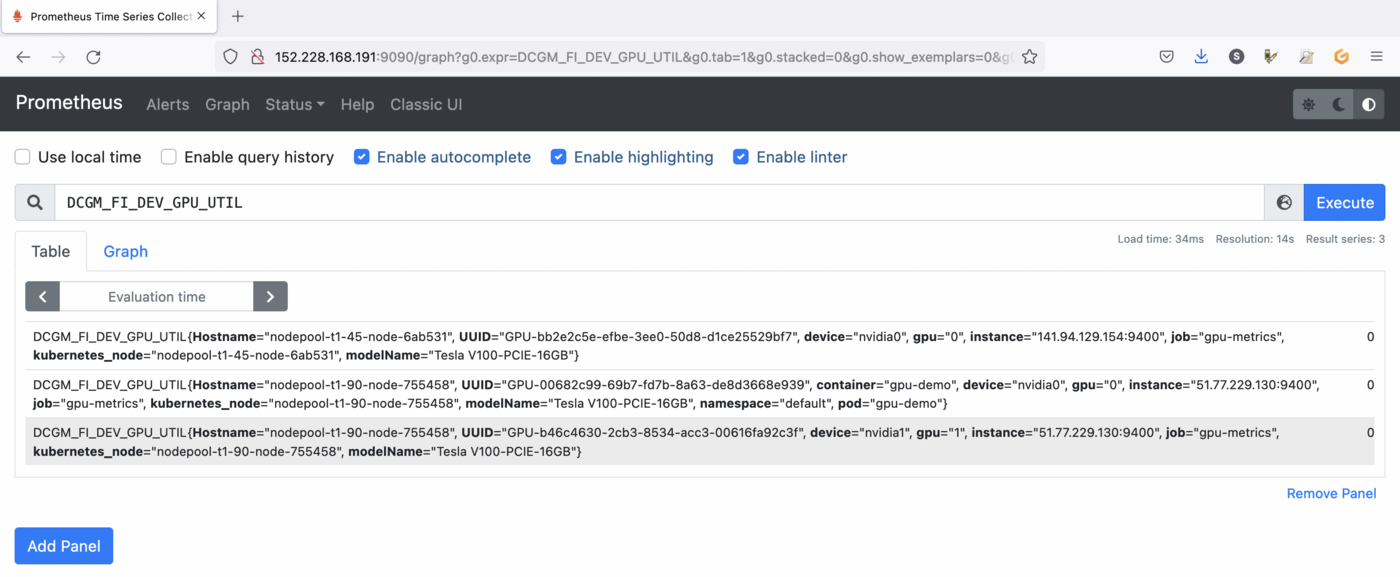
You can check the GPU usage with several metrics in Prometheus:
DCGM_FI_DEV_GPU_UTIL: GPU utilization.DCGM_FI_DEV_SM_CLOCK: SM clock frequency (in MHz).DCGM_FI_DEV_MEM_CLOCK: Memory clock frequency (in MHz).DCGM_FI_DEV_MEMORY_TEMP: Memory temperature (in C).
You can find the full list of metrics exported by DCGM-exporter in the NVIDIA website.
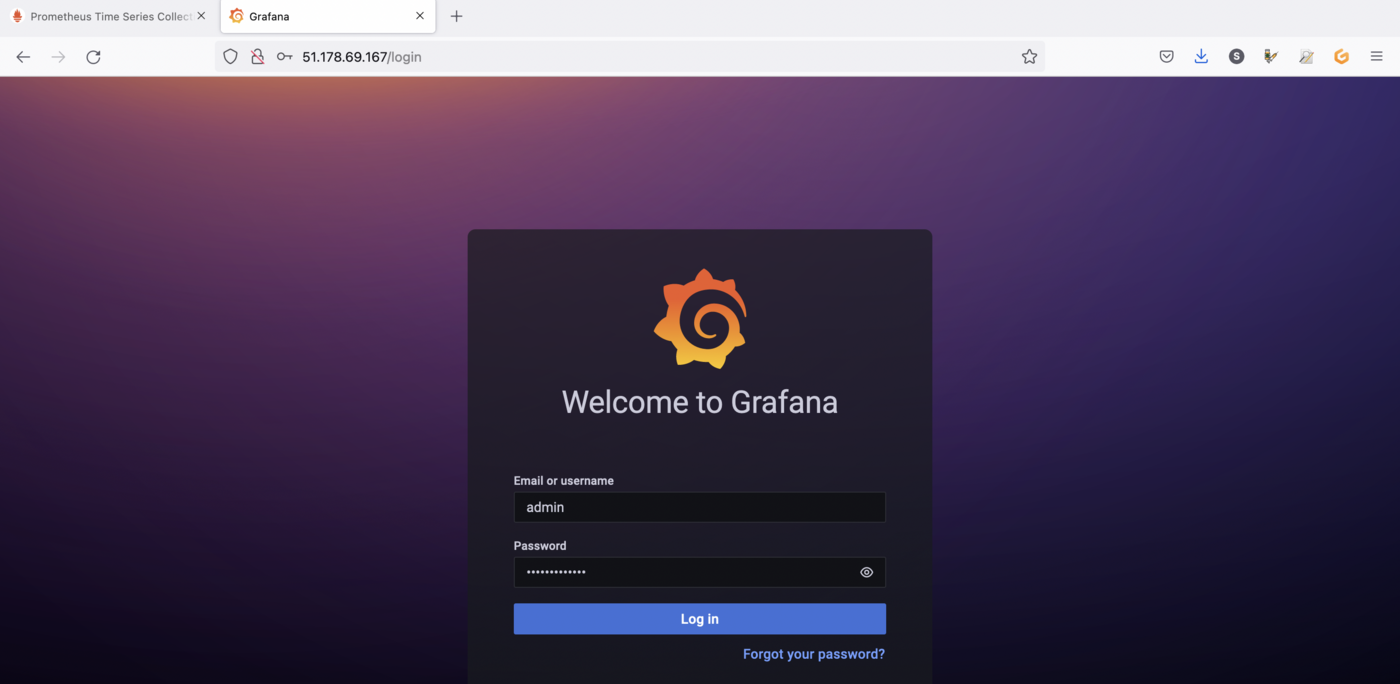
You can also go to the Grafana interface. Open your browser and point to http://$GRAFANA_URL value using the credentials bellow:
- Login:
admin - Password:
prom-operator(by default)
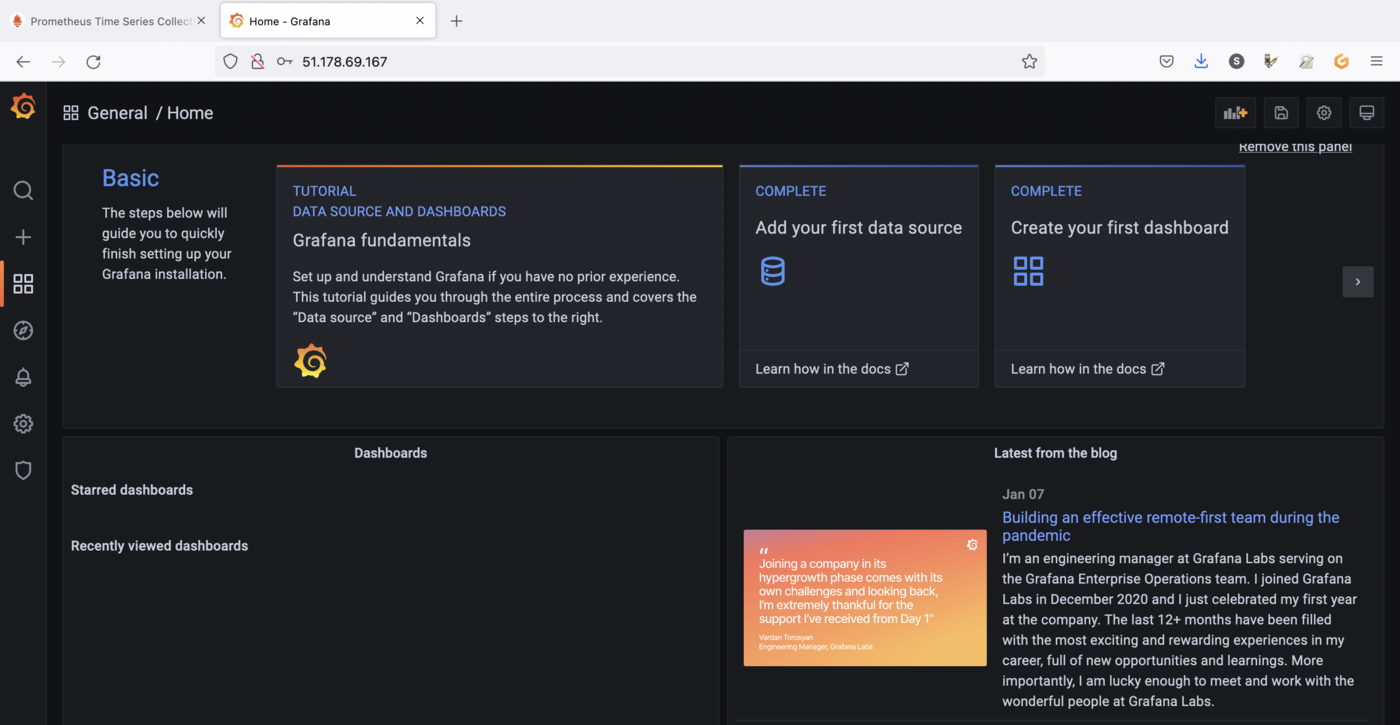
DCGM Dashboard in Grafana
You have a running Prometheus and Grafana, now you need to add a dashboard for DCGM.
To do that, you can use a standard dashboard that NVIDIA released, which can also be customized.
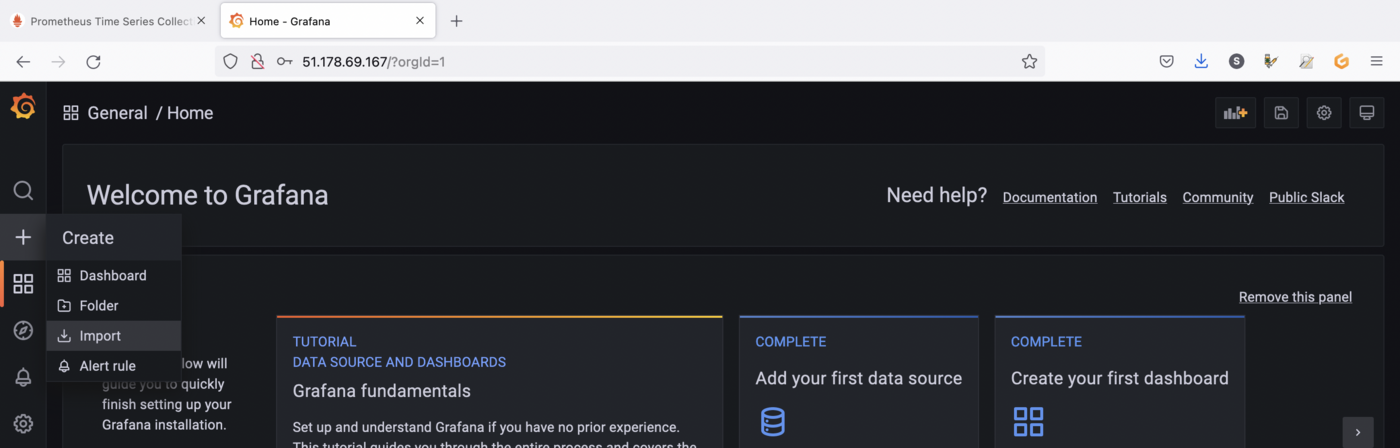
To add the dashboard, in the Grafana sidebar, click on + -> Import:
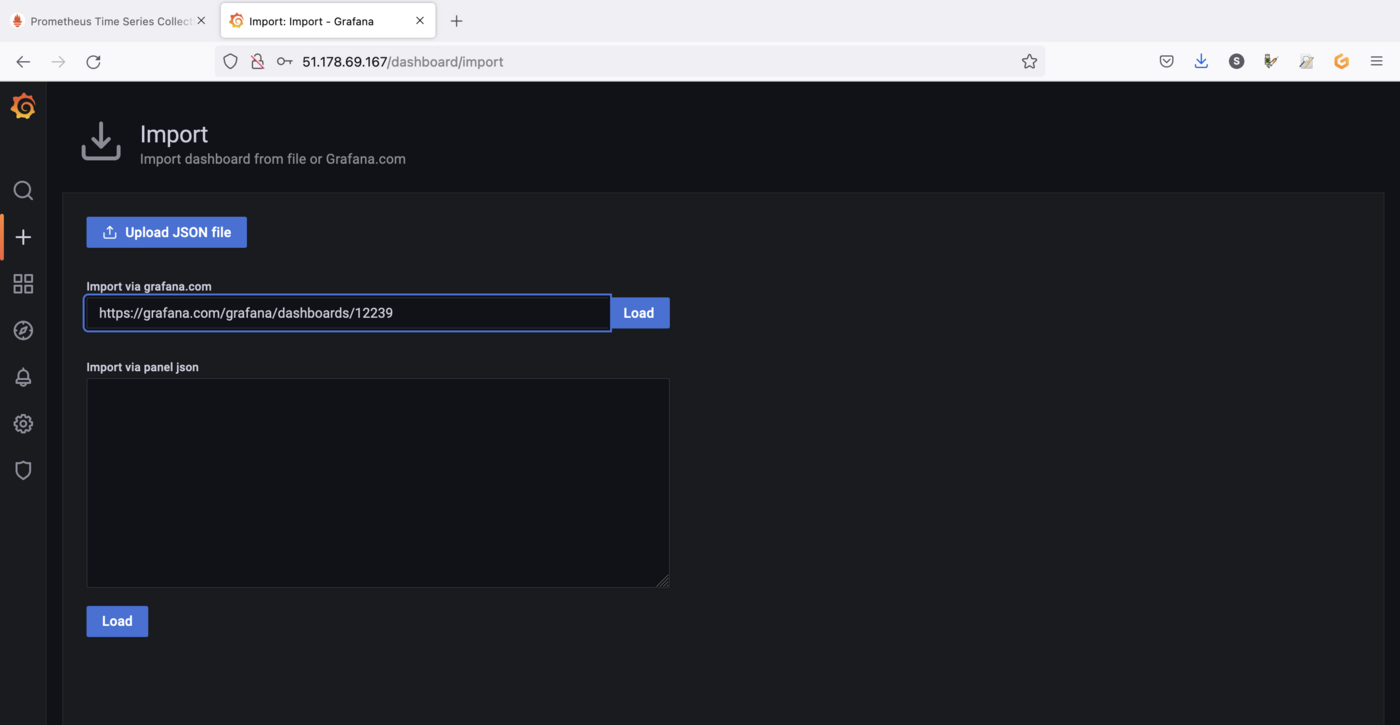
Import the NVIDIA dashboard from https://grafana.com/grafana/dashboards/12239, click on the Load button:
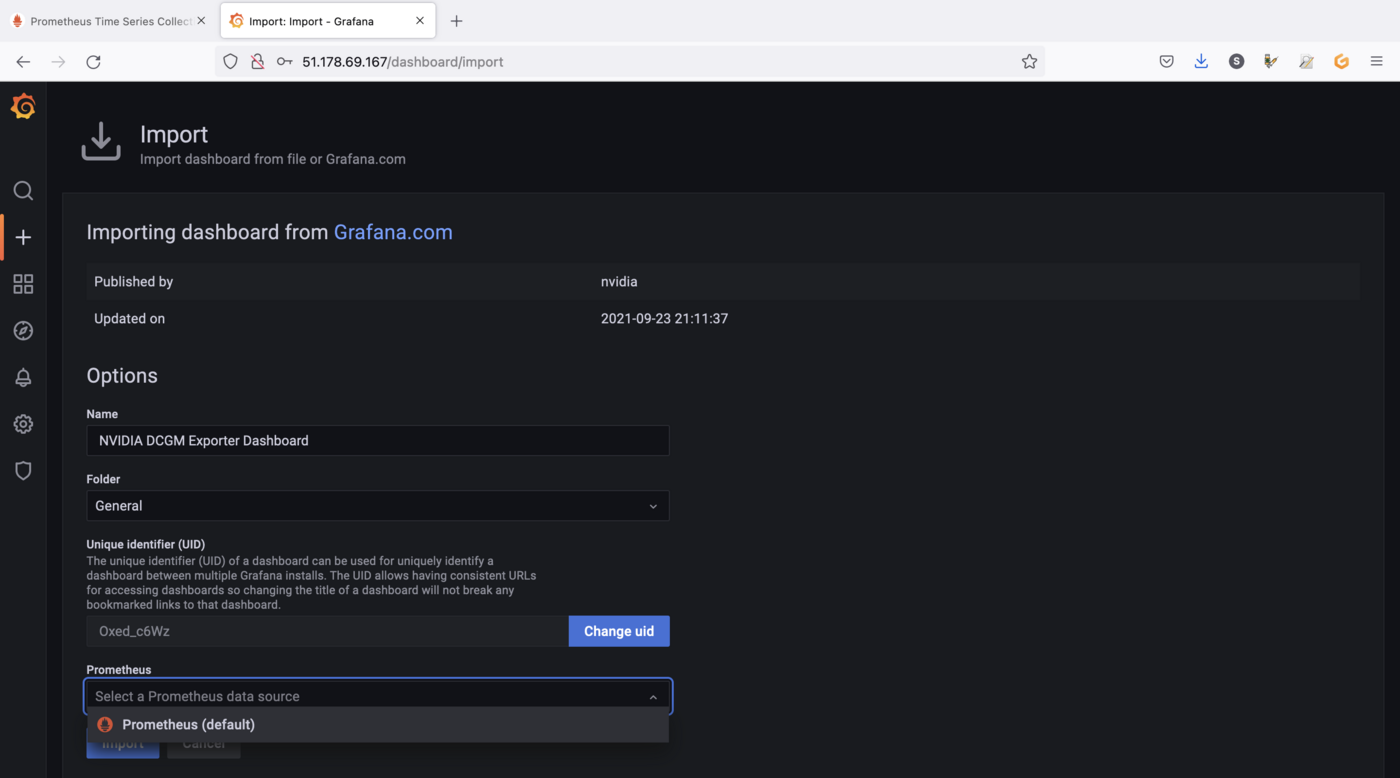
Then choose Prometheus as the data source in the drop down menu and click on the Import button:
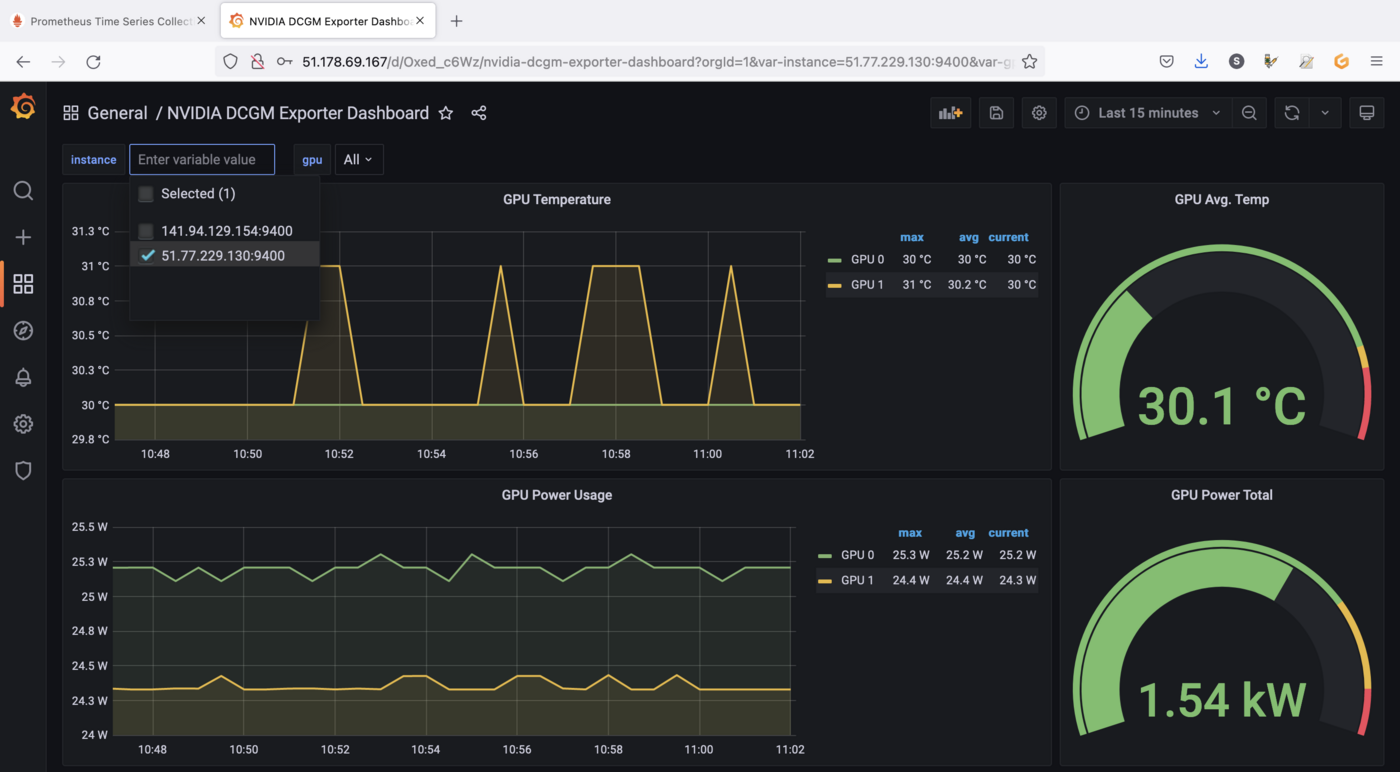
You should now see your new dashboard:
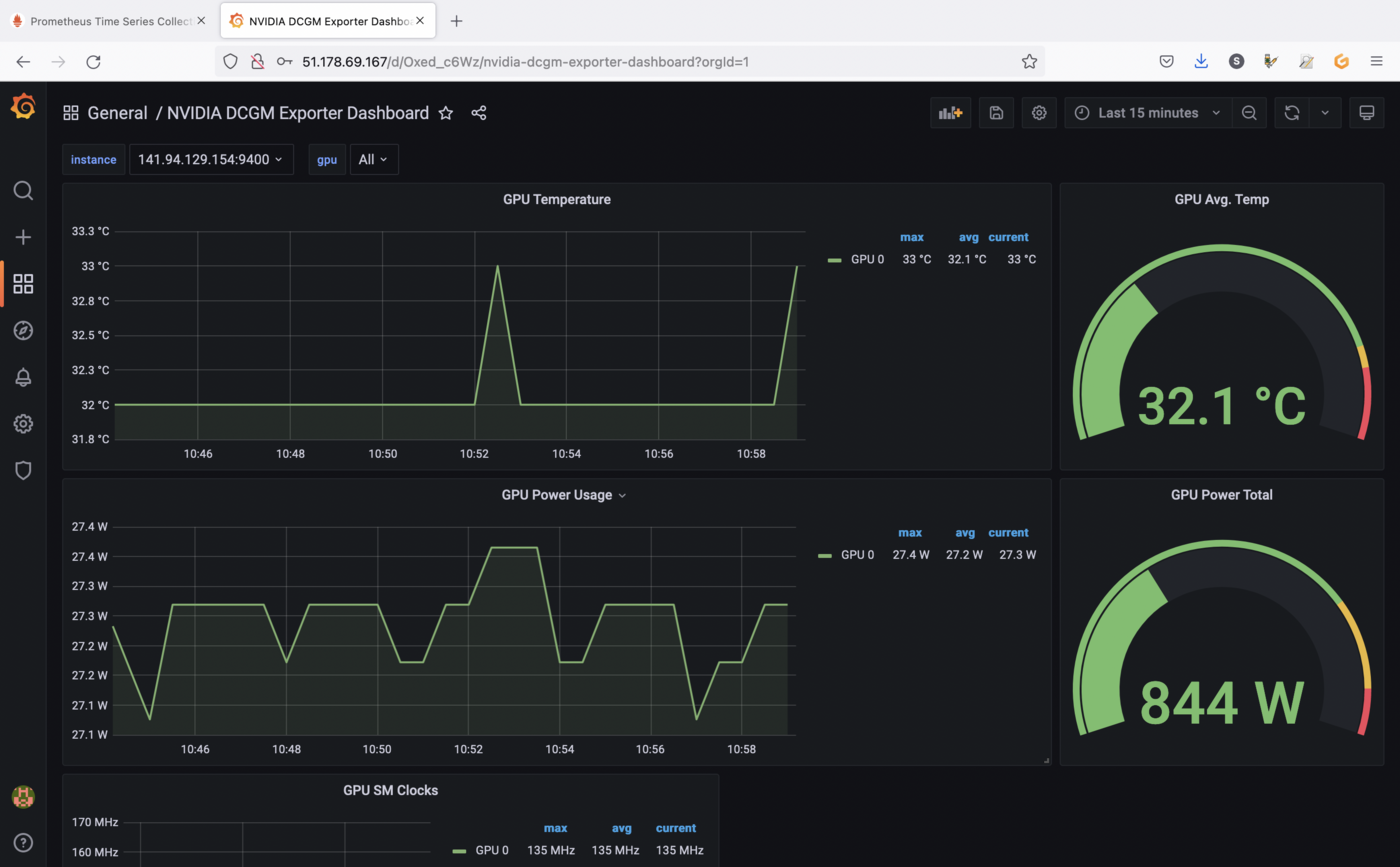
If you followed the Deploying a GPU application on OVHcloud Managed Kubernetes tutorial, you should see metrics like in our example.
You can click on the instance drop down menu in order to visualize GPU metrics for another Node for example:
Visualize metrics for running applications
Now we have a monitoring working stack and a dashboard to visualize our data, it's time to run an application in order to retrieve GPU metrics and viualize interesting data.
As a complex and interesting application using GPU, you can use the standard DeepStream Intelligent Video Analytics Demo available on the NVIDIA NGC registry.
This is an easy to deploy video analytics demo that allows you to demo GPU accelerated video analytics. The container is based on the NVIDIA DeepStream container and leverages its built-in SEnet with resnet18 backend.
The Intelligent Video Analytics demo:
- is an easy to use demo to demonstrate GPU accelerated Inference
- is based on the
NGC Deepstream Container - leverages
Kubernetes,Helm,NGC&DeepStream - does not require a
Video Management System (VMS)
You can deploy the application through NVIDIA Helm chart:
You should have a result like this:
You can check if the application is running correctly:
video-analytics-demo-* and video-analytics-demo-*-webui-* Pods are running.
The demo can be viewed in the browser by pointing to the address given in the following instructions:
Result:
Open the application URL in your browser:
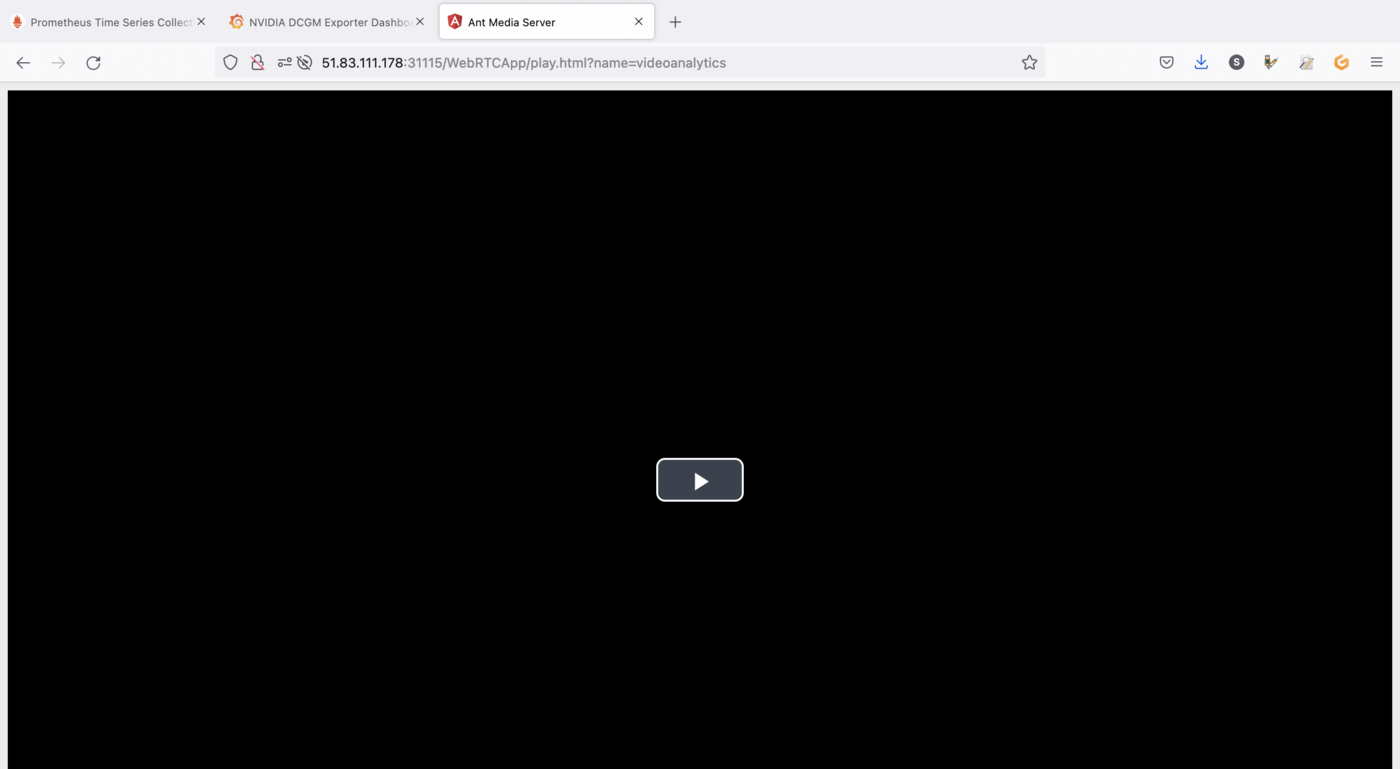
Click on the play button (the button with a triangle) to start the application:
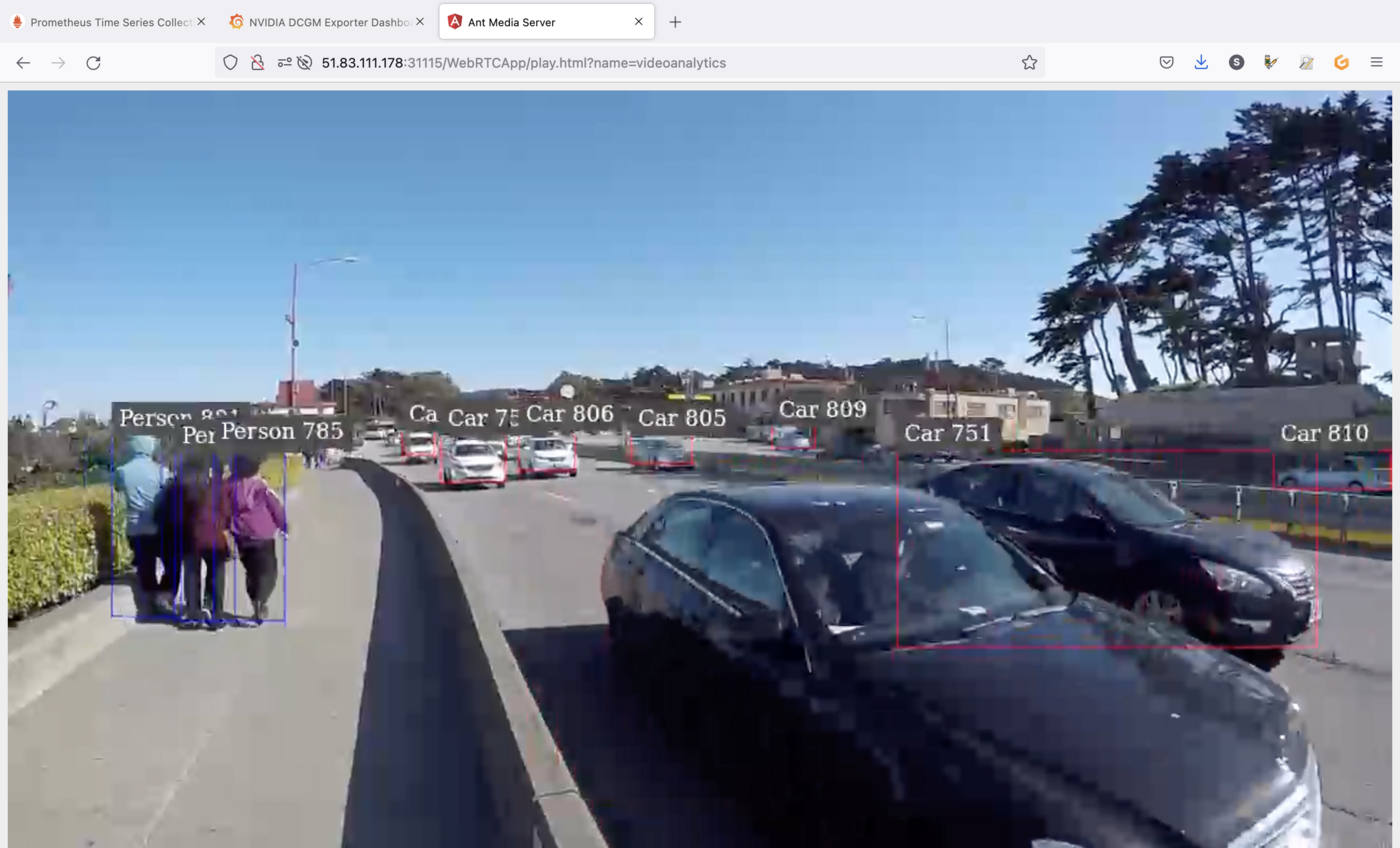
As you can see, the application, that can be used for smart cities use cases, uses the power of GPU in order to detect objects like persons and cars.
Now you can check the metrics in Grafana and watch the evolution of the charts:


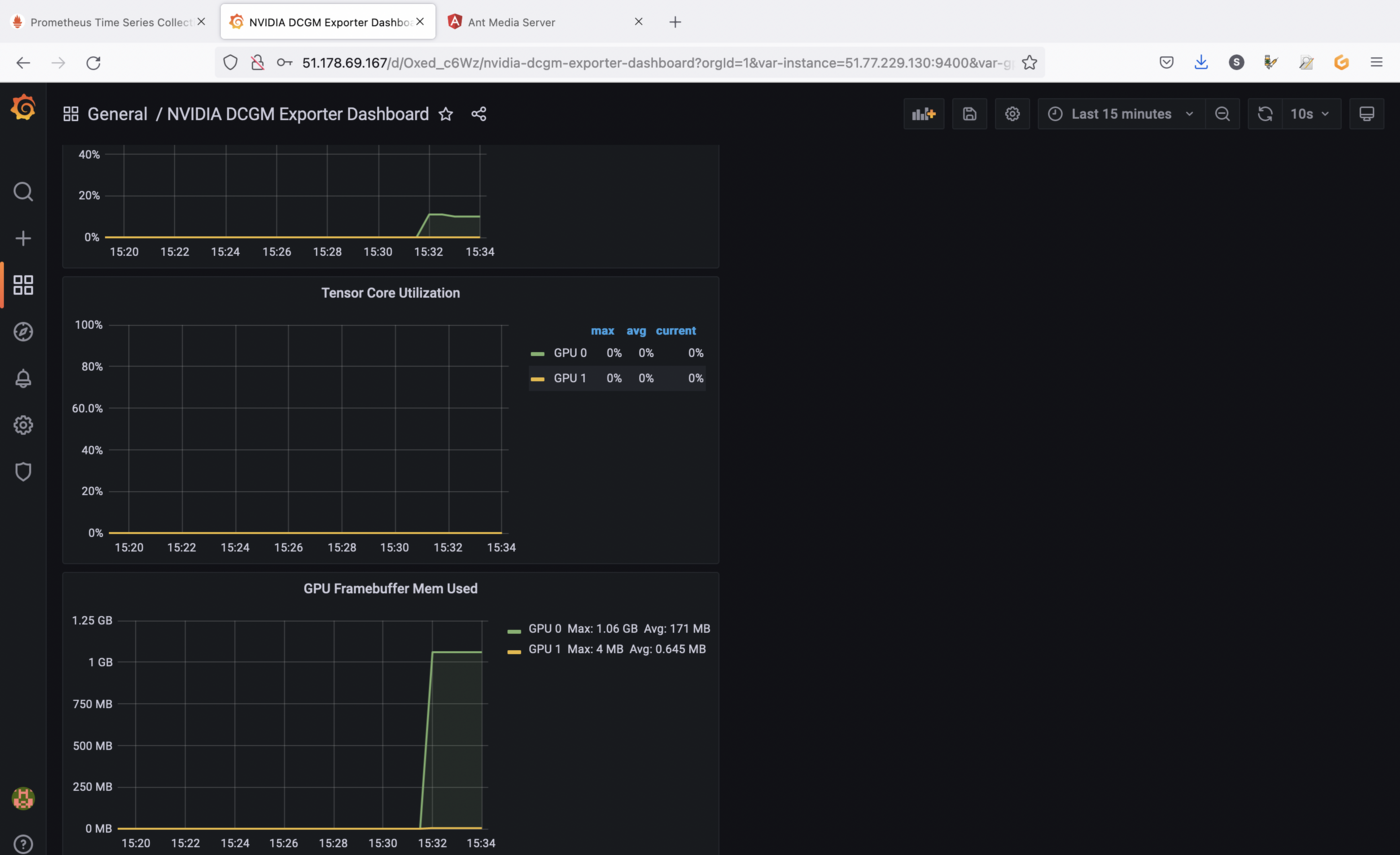
The screenshots are showing GPU utilization and memory allocation on the GPU as long as the application is running.
You can close the application when you finish the tests in order to stop GPU consumption.
Cleanup
First, execute helm list command in every namespaces (with -A option) in your Kubernetes cluster to see what you've installed.
Now, you can delete what you've installed in this tutorial, thanks to helm uninstall commands:
You should have a behavior like this:
Go further
Prometheus and Grafana are very powerful monitoring tools, but also have alerting systems. Don't hesitate to dig in order to create alerts for example.
To learn more about using your Kubernetes cluster the practical way, we invite you to look at our OVHcloud Managed Kubernetes documentation.
-
If you need training or technical assistance to implement our solutions, contact your sales representative or click on this link to get a quote and ask our Professional Services experts for assisting you on your specific use case of your project.
-
Join our community of users.

